Technical Analysis of BAPR 2024-05-10
Overview:
In analyzing the technical indicators for BAPR stock over the last 5 days, we will delve into the trend, momentum, volatility, and volume indicators to provide a comprehensive outlook on the possible stock price movement in the coming days. By examining these key indicators, we aim to offer valuable insights and predictions for potential investors.
Trend Analysis:
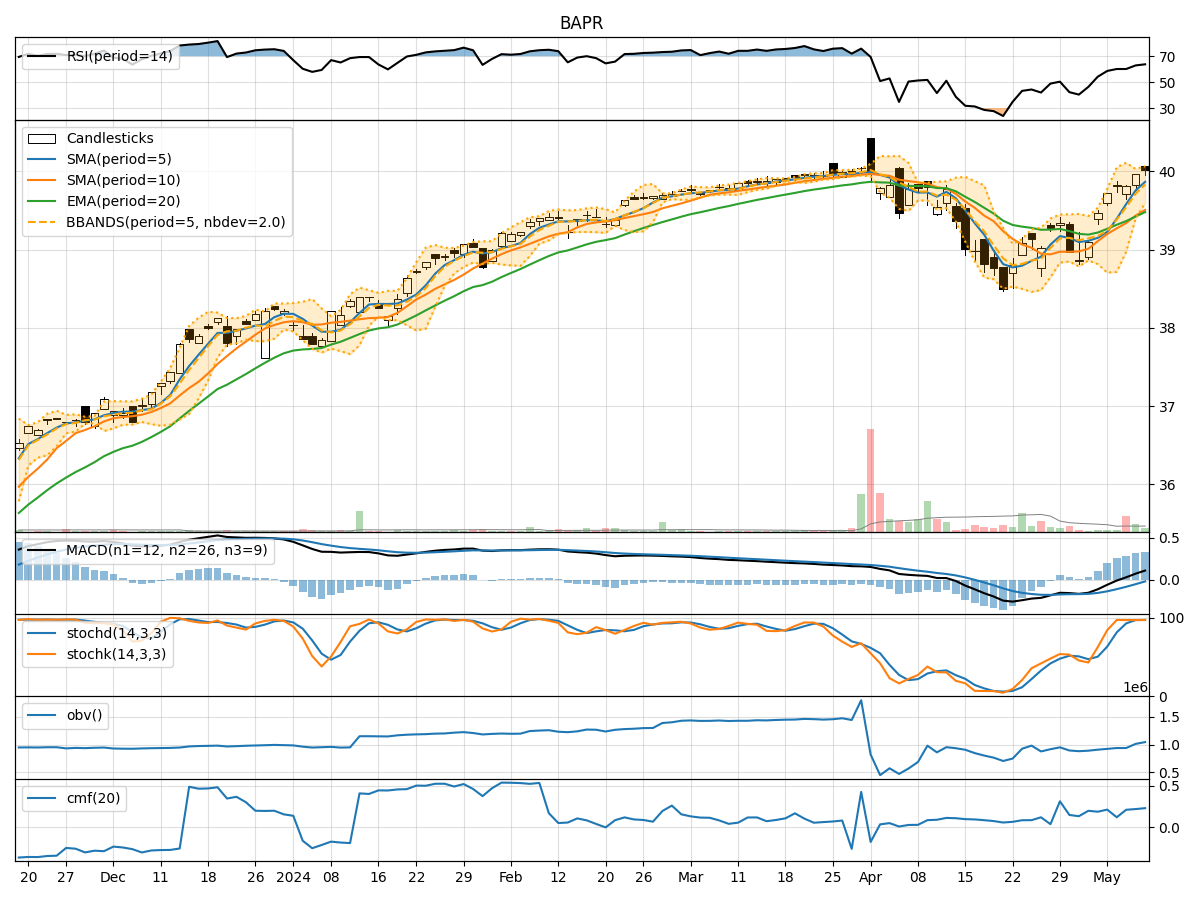
- Moving Averages (MA): The 5-day MA has been consistently above the 10-day SMA, indicating a short-term bullish trend. The EMA(20) has shown a slight upward trend, suggesting positive momentum.
- MACD: The MACD line has been above the signal line for the past 5 days, indicating a bullish trend. The MACD histogram has been steadily increasing, reflecting strengthening bullish momentum.
Momentum Analysis:
- RSI: The RSI has been trending upwards and is currently in the overbought territory, suggesting a potential reversal or consolidation in the near future.
- Stochastic Oscillator: Both %K and %D lines of the Stochastic Oscillator have been in the overbought zone, indicating a possible upcoming bearish reversal.
Volatility Analysis:
- Bollinger Bands (BB): The stock price has been trading within the upper Bollinger Band, indicating an overbought condition. The bands are relatively narrow, suggesting low volatility.
- Bollinger %B: The %B indicator is above 0.8, indicating a potential overbought situation.
Volume Analysis:
- On-Balance Volume (OBV): The OBV has shown a slight decrease over the last 5 days, suggesting some distribution happening in the stock.
- Chaikin Money Flow (CMF): The CMF has been positive, indicating buying pressure in the stock.
Conclusion:
Based on the analysis of the technical indicators, the stock of BAPR is currently in an overbought condition with bullish momentum. However, the RSI and Stochastic Oscillator suggest a potential reversal or consolidation in the near future due to being in the overbought zone. The Bollinger Bands and Bollinger %B also indicate an overbought situation with low volatility.
Therefore, considering the current technical indicators, it is likely that BAPR stock may experience a short-term correction or consolidation in the coming days. Traders should exercise caution and consider taking profits or implementing risk management strategies.