Technical Analysis of BATT 2024-05-10
Overview:
In analyzing the technical indicators for BATT stock over the last 5 days, we will delve into the trends, momentum, volatility, and volume aspects to provide a comprehensive outlook on the possible future stock price movement. By examining key indicators such as moving averages, MACD, RSI, Bollinger Bands, and OBV, we aim to offer valuable insights and predictions for the upcoming trading days.
Trend Analysis:
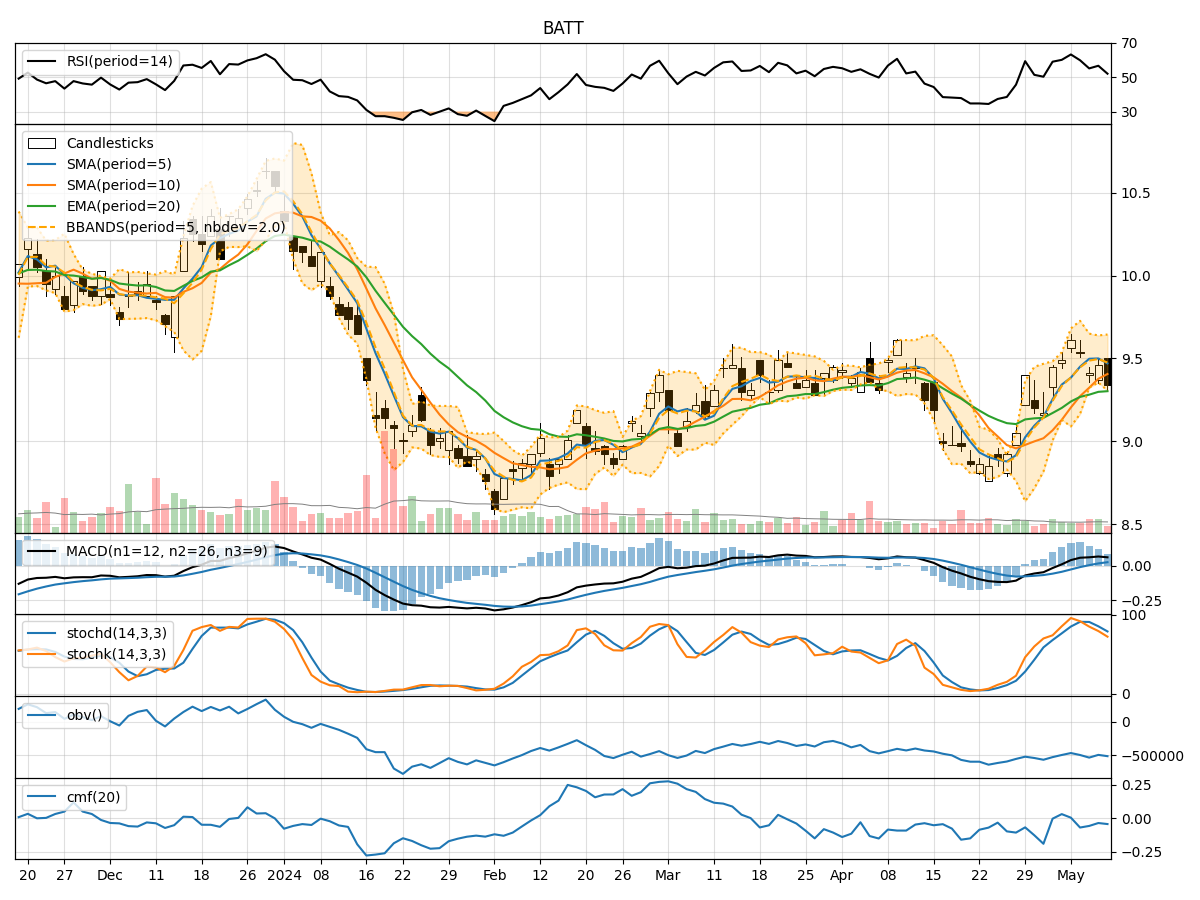
- Moving Averages (MA): The 5-day MA has been fluctuating around the closing prices, indicating short-term price trends. The stock has been trading above the 5-day MA, suggesting a bullish sentiment.
- MACD: The MACD line has been positive, indicating upward momentum in the stock price. The MACD histogram has shown consistent growth, further supporting the bullish trend.
Momentum Analysis:
- RSI: The RSI has been fluctuating in the neutral zone, indicating a balanced momentum between buying and selling pressure.
- Stochastic Oscillator: Both %K and %D have been declining, suggesting a potential reversal in momentum towards the oversold region.
Volatility Analysis:
- Bollinger Bands (BB): The stock price has been trading within the Bollinger Bands, indicating a period of consolidation. The bands have not shown significant expansion or contraction, reflecting stable volatility.
Volume Analysis:
- On-Balance Volume (OBV): The OBV has been fluctuating, indicating mixed sentiment among investors. The declining OBV suggests some distribution happening in the stock.
Key Observations:
- The stock is currently in a bullish trend based on moving averages and MACD.
- Momentum indicators like RSI and Stochastic Oscillator suggest a neutral sentiment with a potential shift towards oversold conditions.
- Volatility remains stable as per Bollinger Bands, indicating a period of consolidation.
- The OBV reflects mixed sentiment among investors, with some distribution evident.
Conclusion:
Based on the analysis of technical indicators, the next few days for BATT stock are likely to see sideways movement with a slight bearish bias. Investors should closely monitor the momentum indicators for any potential reversal signals. It is advisable to exercise caution and wait for clearer signals before making significant trading decisions.