Technical Analysis of BBAX 2024-05-10
Overview:
In the last 5 trading days, BBAX stock has shown a mix of positive and negative price movements along with various technical indicators suggesting different trends. By analyzing the trend, momentum, volatility, and volume indicators, we can gain insights into the possible future price movement of BBAX stock.
Trend Analysis:
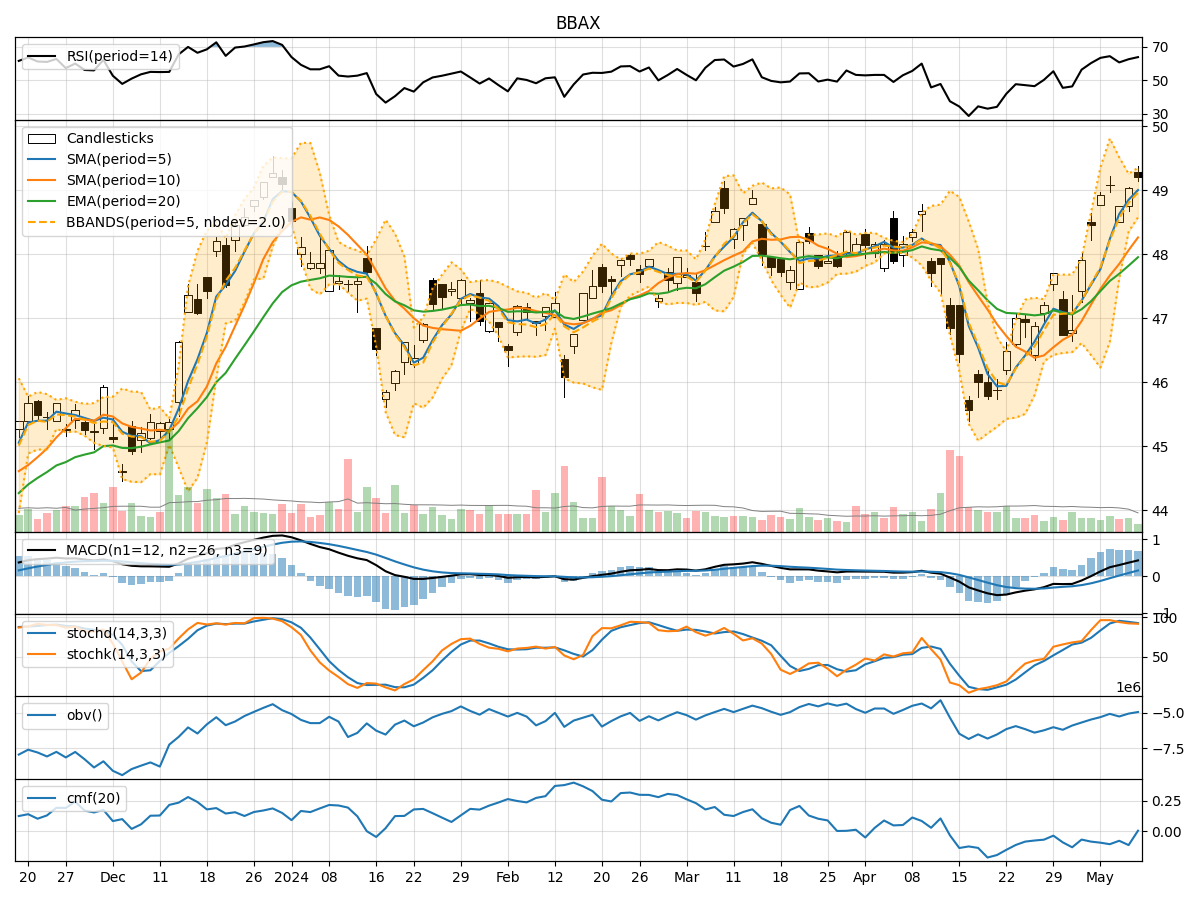
- Moving Averages (MA): The 5-day Moving Average (MA) has been consistently above the Simple Moving Average (SMA) and Exponential Moving Average (EMA), indicating a short-term uptrend.
- MACD: The MACD line has been consistently above the signal line, suggesting a bullish momentum in the stock price.
- RSI: The Relative Strength Index (RSI) has been fluctuating around the overbought territory, indicating a strong bullish momentum.
Key Observation: The trend indicators suggest a bullish sentiment in the stock price.
Momentum Analysis:
- Stochastic Oscillator: The Stochastic Oscillator has been gradually decreasing but still remains in the overbought zone, indicating a potential reversal in the bullish momentum.
- Williams %R: The Williams %R is also in the overbought zone, suggesting a possible correction in the stock price.
Key Observation: Momentum indicators are showing signs of potential reversal or consolidation.
Volatility Analysis:
- Bollinger Bands (BB): The Bollinger Bands have been narrowing, indicating decreasing volatility in the stock price.
- BB% (Bollinger Band %B): The %B value has been fluctuating around 0.5, suggesting the stock is trading near the middle band.
Key Observation: Volatility indicators point towards a period of consolidation or a potential breakout.
Volume Analysis:
- On-Balance Volume (OBV): The OBV has been showing mixed signals, indicating indecision among investors.
- Chaikin Money Flow (CMF): The CMF has been negative, suggesting a lack of buying pressure in the stock.
Key Observation: Volume indicators reflect uncertainty in the market sentiment.
Conclusion:
Based on the analysis of the technical indicators: - Trend: The stock is currently in an upward trend. - Momentum: Momentum indicators suggest a potential reversal or consolidation in the near term. - Volatility: Volatility indicators point towards a period of consolidation. - Volume: Volume indicators indicate uncertainty in market sentiment.
Overall View:
Considering the mixed signals from the technical indicators, it is likely that BBAX stock may experience a period of consolidation in the next few days. Traders should closely monitor key support and resistance levels for potential breakout opportunities.