Technical Analysis of BBBI 2024-05-10
Overview:
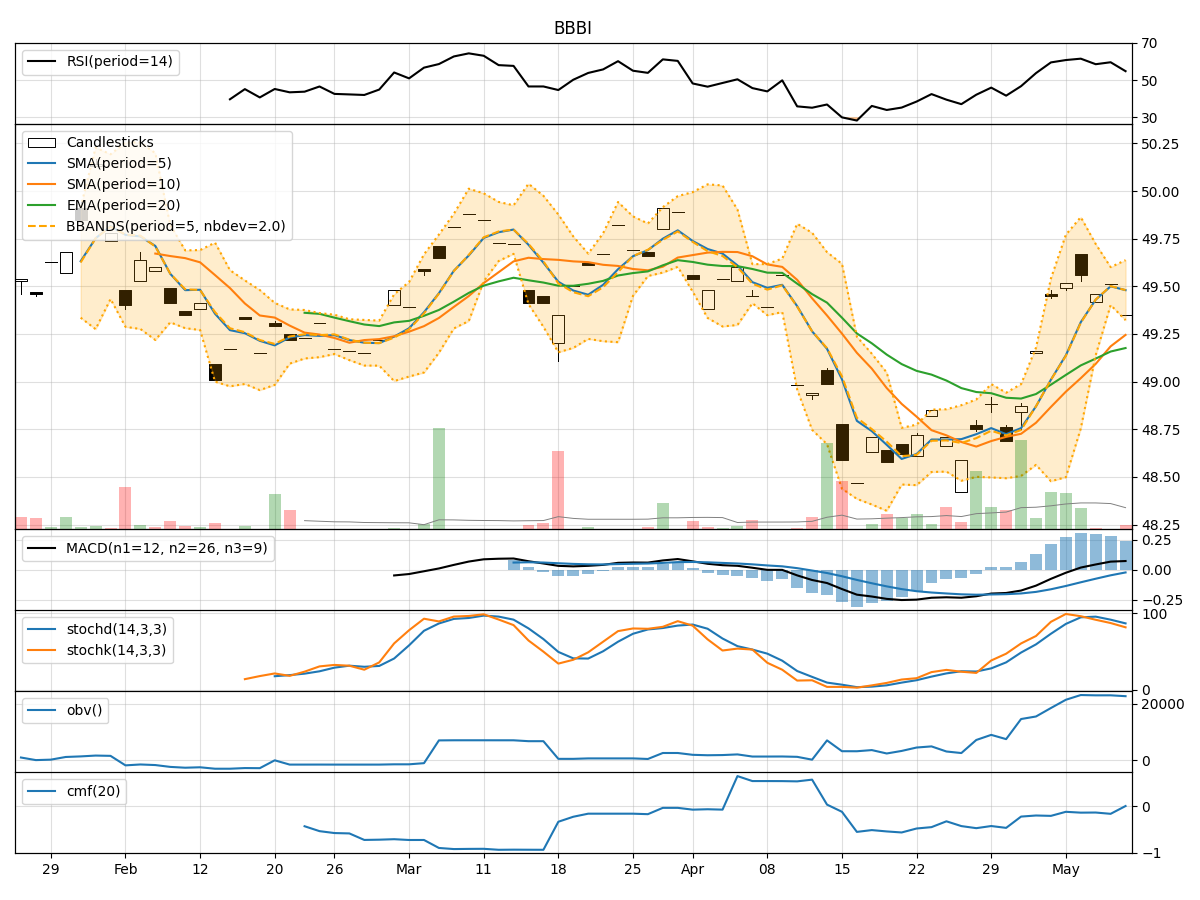
In analyzing the technical indicators for BBBI over the last 5 days, we will delve into the trend, momentum, volatility, and volume indicators to provide a comprehensive outlook on the possible stock price movement in the coming days. By examining these key indicators, we aim to offer valuable insights and predictions for potential investors.
Trend Indicators:
- Moving Averages (MA): The 5-day Moving Average (MA) has been consistently above the Simple Moving Average (SMA) and Exponential Moving Average (EMA), indicating a bullish trend.
- MACD: The MACD line has been consistently above the signal line, suggesting a positive momentum in the stock price.
- MACD Histogram: The MACD Histogram has been gradually decreasing but remains in positive territory, indicating a potential slowdown in the bullish momentum.
Momentum Indicators:
- RSI: The Relative Strength Index (RSI) has been fluctuating around the 50 level, indicating a neutral momentum in the stock.
- Stochastic Oscillator: Both %K and %D have been declining, suggesting a weakening momentum in the stock price.
- Williams %R: The Williams %R is in oversold territory, indicating a potential reversal in the stock price.
Volatility Indicators:
- Bollinger Bands: The Bollinger Bands have been narrowing, indicating decreasing volatility in the stock price.
- Bollinger %B: The %B indicator is close to the lower band, suggesting a possible oversold condition in the stock.
Volume Indicators:
- On-Balance Volume (OBV): The OBV has been relatively flat, indicating a balance between buying and selling pressure.
- Chaikin Money Flow (CMF): The CMF has been negative, indicating a bearish money flow in the stock.
Key Observations:
- The trend indicators suggest a bullish sentiment in the stock price, supported by the moving averages and MACD.
- Momentum indicators show a neutral to slightly bearish momentum, with the RSI hovering around 50 and stochastic indicators pointing towards a weakening trend.
- Volatility indicators indicate decreasing volatility, potentially leading to a period of consolidation.
- Volume indicators reflect a balanced buying and selling pressure, with a bearish money flow indicated by the CMF.
Conclusion:
Based on the analysis of the technical indicators, the next few days' possible stock price movement for BBBI is likely to be sideways with a slight bearish bias. The bullish trend indicated by the moving averages and MACD may face resistance due to the neutral to bearish momentum and decreasing volatility. Investors should exercise caution and consider waiting for clearer signals before making significant trading decisions.