Technical Analysis of BBBS 2024-05-10
Overview:
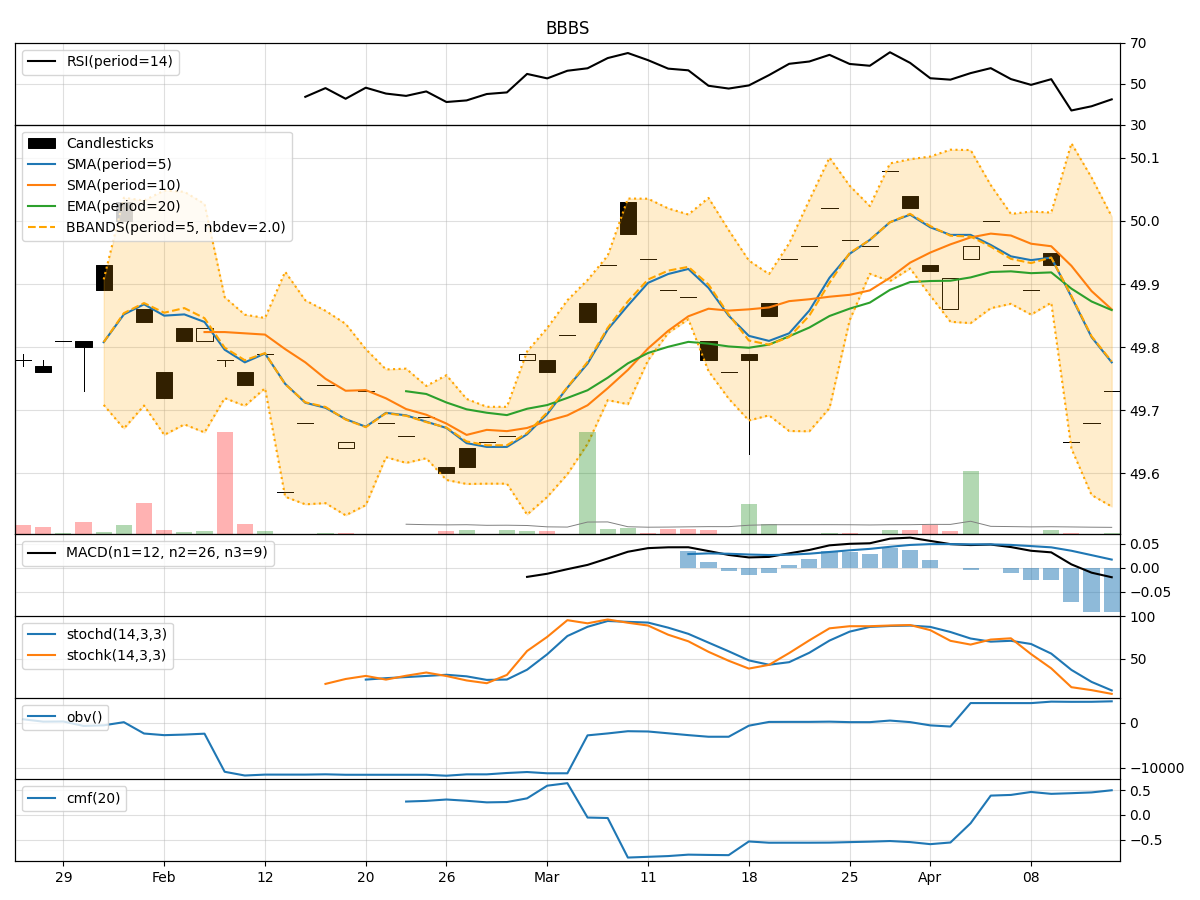
In analyzing the technical indicators for BBBS over the last 5 days, we will delve into the trend, momentum, volatility, and volume indicators to provide a comprehensive outlook on the possible stock price movement in the coming days. By examining these key aspects, we aim to offer valuable insights and predictions to guide your investment decisions.
Trend Indicators:
- Moving Averages (MA): The 5-day Moving Average (MA) has been consistently above the Simple Moving Average (SMA) and Exponential Moving Average (EMA), indicating a bullish trend.
- MACD: The MACD line has been consistently above the signal line, suggesting positive momentum in the stock price.
- MACD Histogram: The MACD Histogram has been increasing, indicating strengthening bullish momentum.
Momentum Indicators:
- RSI: The Relative Strength Index (RSI) has been fluctuating around the 60-70 range, indicating a neutral momentum.
- Stochastic Oscillator: Both %K and %D have been gradually decreasing, signaling a potential bearish momentum.
- Williams %R: The Williams %R is in the oversold territory, suggesting a possible reversal in the short term.
Volatility Indicators:
- Bollinger Bands: The stock price has been trading within the Bollinger Bands, with the bands narrowing, indicating decreasing volatility.
- Bollinger %B: The %B indicator is hovering around 0.5, suggesting a neutral stance in terms of volatility.
Volume Indicators:
- On-Balance Volume (OBV): The OBV has been relatively flat, indicating a balance between buying and selling pressure.
- Chaikin Money Flow (CMF): The CMF has been consistently negative, indicating outflow of money from the stock.
Key Observations and Opinions:
- Trend: The stock is currently in an upward trend based on moving averages and MACD analysis.
- Momentum: Momentum indicators suggest a neutral to bearish bias in the short term.
- Volatility: Volatility is decreasing, potentially leading to a period of consolidation.
- Volume: The volume indicators show a lack of significant buying interest, reflecting a cautious market sentiment.
Conclusion:
Based on the analysis of the technical indicators, the next few days for BBBS stock are likely to see sideways movement or a slight pullback. While the trend remains bullish, the momentum indicators and volume suggest a possible short-term correction or consolidation. Traders may consider waiting for clearer signals before making significant trading decisions.