Technical Analysis of BBC 2024-05-10
Overview:
In analyzing the technical indicators for BBC stock over the last 5 days, we will delve into the trend, momentum, volatility, and volume indicators to provide a comprehensive outlook on the possible stock price movement in the coming days. By examining key metrics such as moving averages, MACD, RSI, Bollinger Bands, and volume trends, we aim to offer valuable insights and predictions for potential price action.
Trend Indicators:
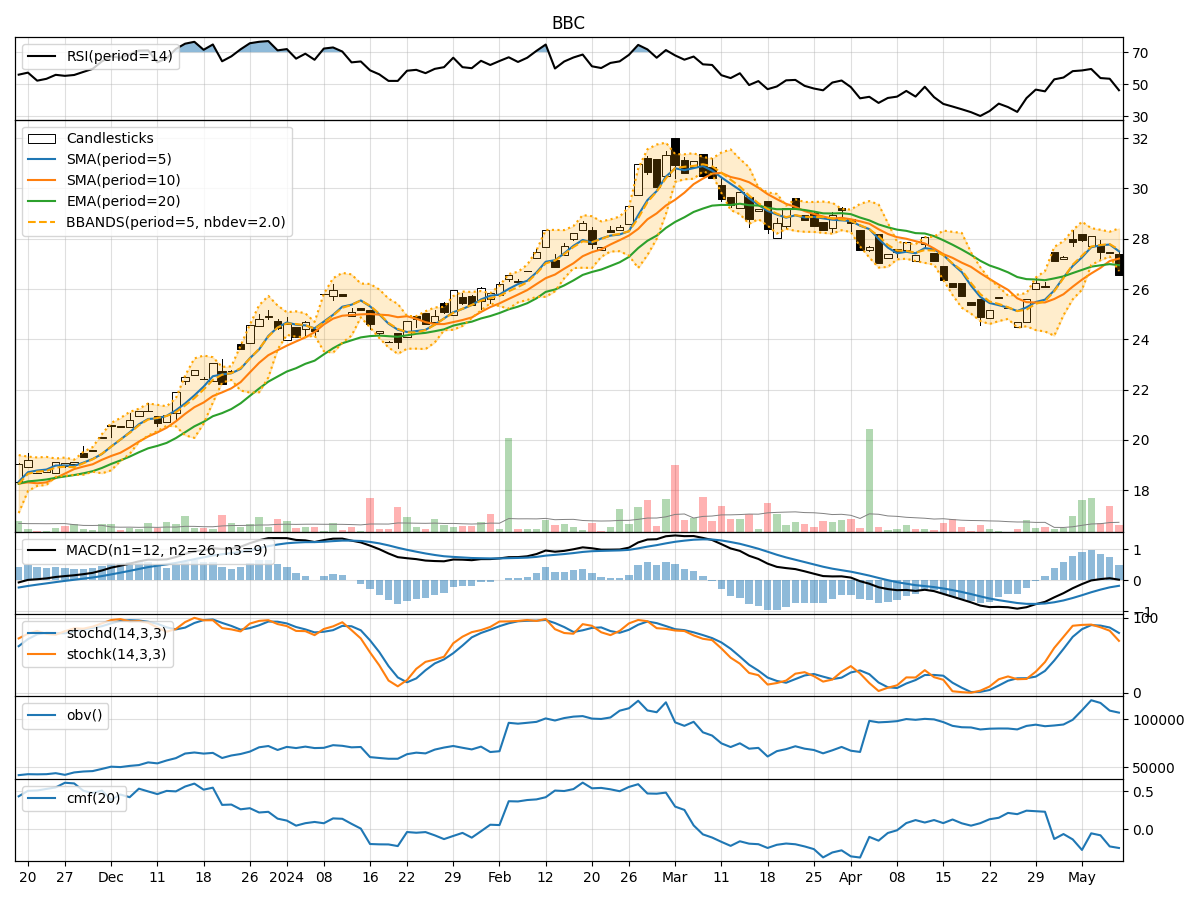
- Moving Averages (MA): The 5-day MA has been fluctuating around the closing prices, indicating short-term price trends. The SMA(10) and EMA(20) have shown a slight upward trend, suggesting a potential bullish sentiment.
- MACD: The MACD line has been positive, indicating a bullish momentum, with the MACD histogram showing an increasing trend over the past few days.
Momentum Indicators:
- RSI: The RSI has been hovering around the neutral zone, indicating a balanced momentum without extreme overbought or oversold conditions.
- Stochastic Oscillator: The Stochastics have shown a gradual decline from overbought levels, suggesting a potential shift towards a bearish sentiment.
Volatility Indicators:
- Bollinger Bands: The stock price has been trading within the Bollinger Bands, with the bands narrowing, indicating decreasing volatility and a possible consolidation phase.
- Bollinger %B: The %B indicator has been relatively stable, suggesting a lack of significant price movements.
Volume Indicators:
- On-Balance Volume (OBV): The OBV has shown mixed signals, with fluctuations in volume accumulation, indicating indecision among market participants.
- Chaikin Money Flow (CMF): The CMF has been negative, reflecting selling pressure and a potential bearish sentiment in the market.
Conclusion:
Based on the analysis of the technical indicators, the stock is likely to experience sideways movement in the coming days, with a potential bearish bias due to the declining Stochastic Oscillator and negative CMF. The narrowing Bollinger Bands suggest a period of consolidation, while the RSI indicates a neutral momentum. Traders should exercise caution and consider waiting for clearer signals before making significant trading decisions.