Technical Analysis of BBH 2024-05-10
Overview:
In analyzing the technical indicators for BBH over the last 5 days, we will delve into the trend, momentum, volatility, and volume indicators to provide a comprehensive outlook on the possible stock price movement. By examining these key aspects, we aim to offer valuable insights and predictions for the upcoming days.
Trend Analysis:
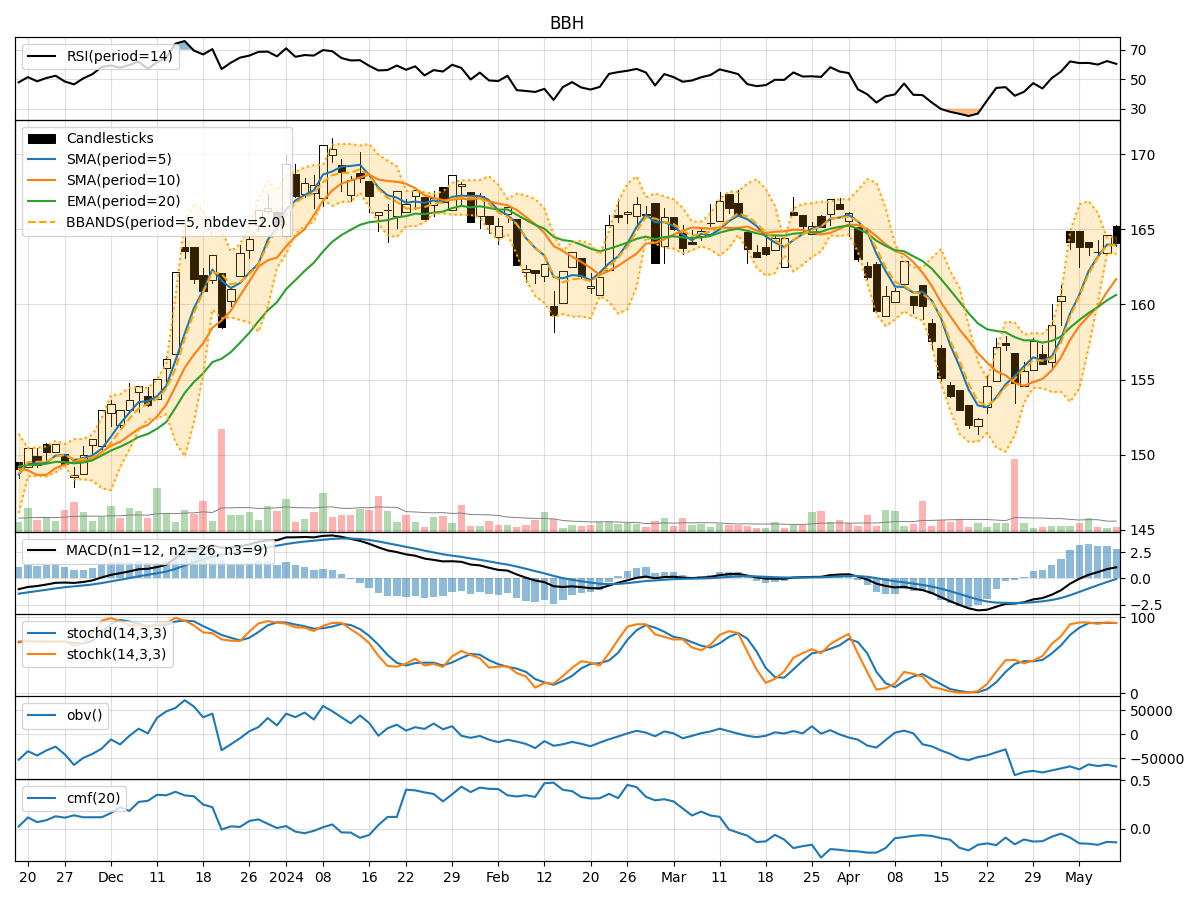
- Moving Averages (MA): The 5-day Moving Average (MA) has been consistently above both the Simple Moving Average (SMA) and Exponential Moving Average (EMA), indicating a bullish trend.
- MACD: The MACD line has been consistently above the signal line, suggesting a bullish momentum in the stock price.
- Conclusion: The trend indicators point towards an upward movement in the stock price.
Momentum Analysis:
- RSI: The Relative Strength Index (RSI) has been fluctuating around the 60-62 range, indicating a neutral momentum.
- Stochastic Oscillator: Both %K and %D have been hovering around the 90 range, suggesting a strong bullish momentum.
- Conclusion: The momentum indicators suggest a bullish sentiment in the stock.
Volatility Analysis:
- Bollinger Bands (BB): The stock price has been trading within the Bollinger Bands, with the bands narrowing over the last few days, indicating decreasing volatility.
- Conclusion: Volatility indicators signal a consolidation phase in the stock price.
Volume Analysis:
- On-Balance Volume (OBV): The OBV has been negative, indicating a net selling pressure in the stock.
- Chaikin Money Flow (CMF): The CMF has been consistently negative, reflecting a lack of buying interest.
- Conclusion: Volume indicators suggest a bearish sentiment in the stock.
Overall Conclusion:
Based on the analysis of trend, momentum, volatility, and volume indicators, the next few days' possible stock price movement for BBH is likely to be sideways with a slight bearish bias. While the trend and momentum indicators point towards a potential upward movement, the volume and volatility indicators signal a more cautious outlook. Investors should closely monitor the stock for any shifts in these indicators to make informed trading decisions.
Recommendation:
Given the mixed signals from the technical indicators, it is advisable for investors to exercise caution and wait for more clarity in the market dynamics before making significant trading decisions. Keep a close eye on key support and resistance levels, as well as any developments in the broader market that could impact BBH's price movement.