Technical Analysis of BBIB 2024-05-10
Overview:
In analyzing the technical indicators for BBIB stock over the last 5 days, we will delve into the trends, momentum, volatility, and volume indicators to provide a comprehensive outlook on the possible stock price movement in the coming days. By examining these key aspects, we aim to offer valuable insights and recommendations for potential investors.
Trend Analysis:
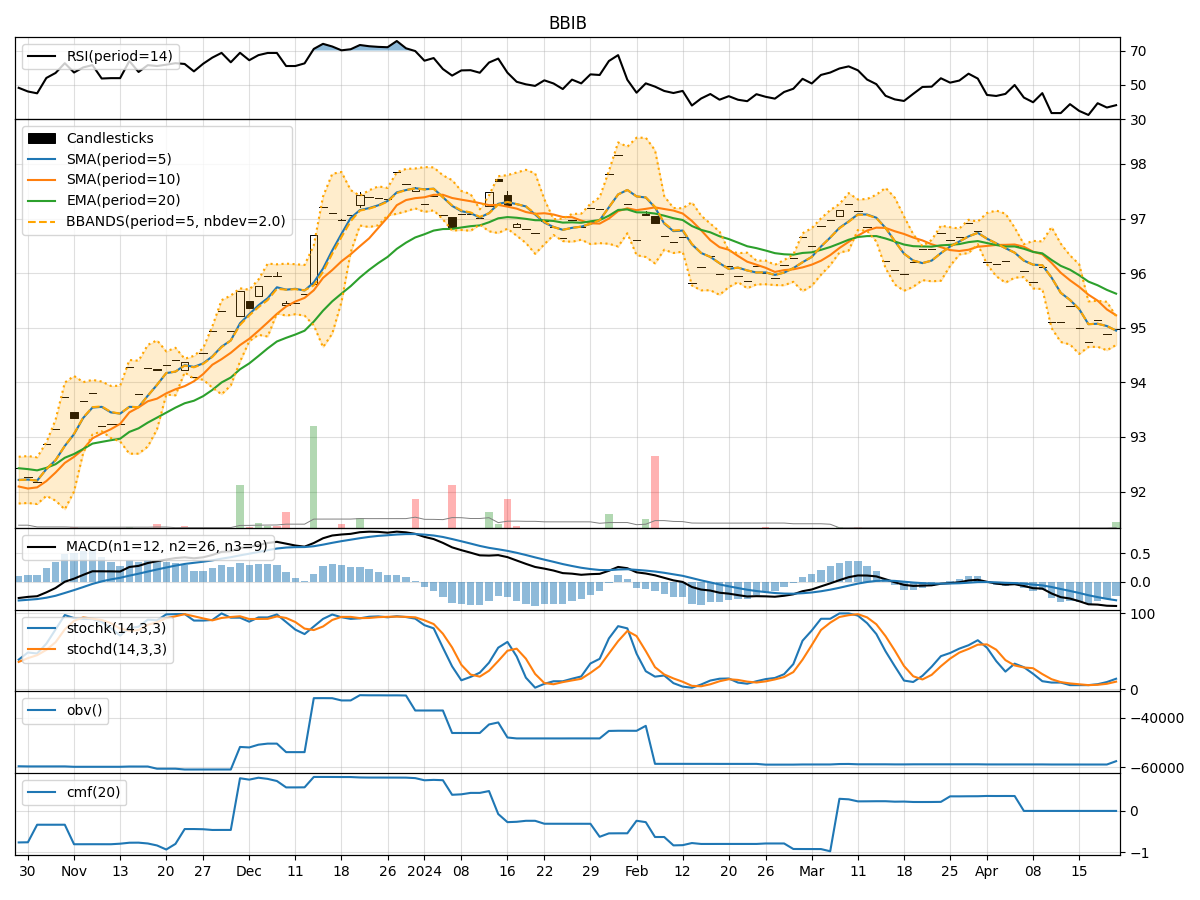
- Moving Averages (MA): The 5-day MA has been consistently above the closing prices, indicating a short-term uptrend.
- MACD: The MACD line has been above the signal line, suggesting bullish momentum.
- EMA: The EMA has been trending upwards, supporting the bullish sentiment.
- Conclusion: The trend indicators point towards an upward movement in the stock price.
Momentum Analysis:
- RSI: The RSI has been fluctuating around the 50 level, indicating a neutral momentum.
- Stochastic Oscillator: Both %K and %D have been declining, signaling a potential reversal in momentum.
- Williams %R: The indicator has been in oversold territory, suggesting a possible bounce back.
- Conclusion: The momentum indicators suggest a sideways to slightly bullish momentum in the near term.
Volatility Analysis:
- Bollinger Bands: The stock price has been trading within the bands, indicating stable volatility.
- Conclusion: Volatility indicators suggest a stable price movement with no significant spikes expected.
Volume Analysis:
- On-Balance Volume (OBV): The OBV has been relatively flat, indicating no significant accumulation or distribution.
- Chaikin Money Flow (CMF): The CMF has been consistently at 0, reflecting a lack of buying or selling pressure.
- Conclusion: Volume indicators suggest a neutral sentiment with no clear direction in volume flow.
Key Observations:
- The trend indicators are bullish, indicating a potential upward movement in the stock price.
- Momentum indicators show a mixed signal, with a slight bias towards a sideways to bullish momentum.
- Volatility remains stable, suggesting no major price swings expected.
- Volume indicators reflect a neutral sentiment with no significant buying or selling pressure.
Conclusion:
Based on the analysis of the technical indicators, the next few days' possible stock price movement for BBIB is likely to be upward. Investors may consider taking a bullish stance and monitor the momentum indicators closely for any potential shifts. It is essential to exercise caution and set appropriate stop-loss levels to manage risks effectively.