Technical Analysis of BBIN 2024-05-10
Overview:
In analyzing the technical indicators for BBIN stock over the last 5 days, we will delve into the trend, momentum, volatility, and volume indicators to provide a comprehensive outlook on the possible future stock price movement. By examining these key aspects, we aim to offer valuable insights and recommendations for potential investors.
Trend Analysis:
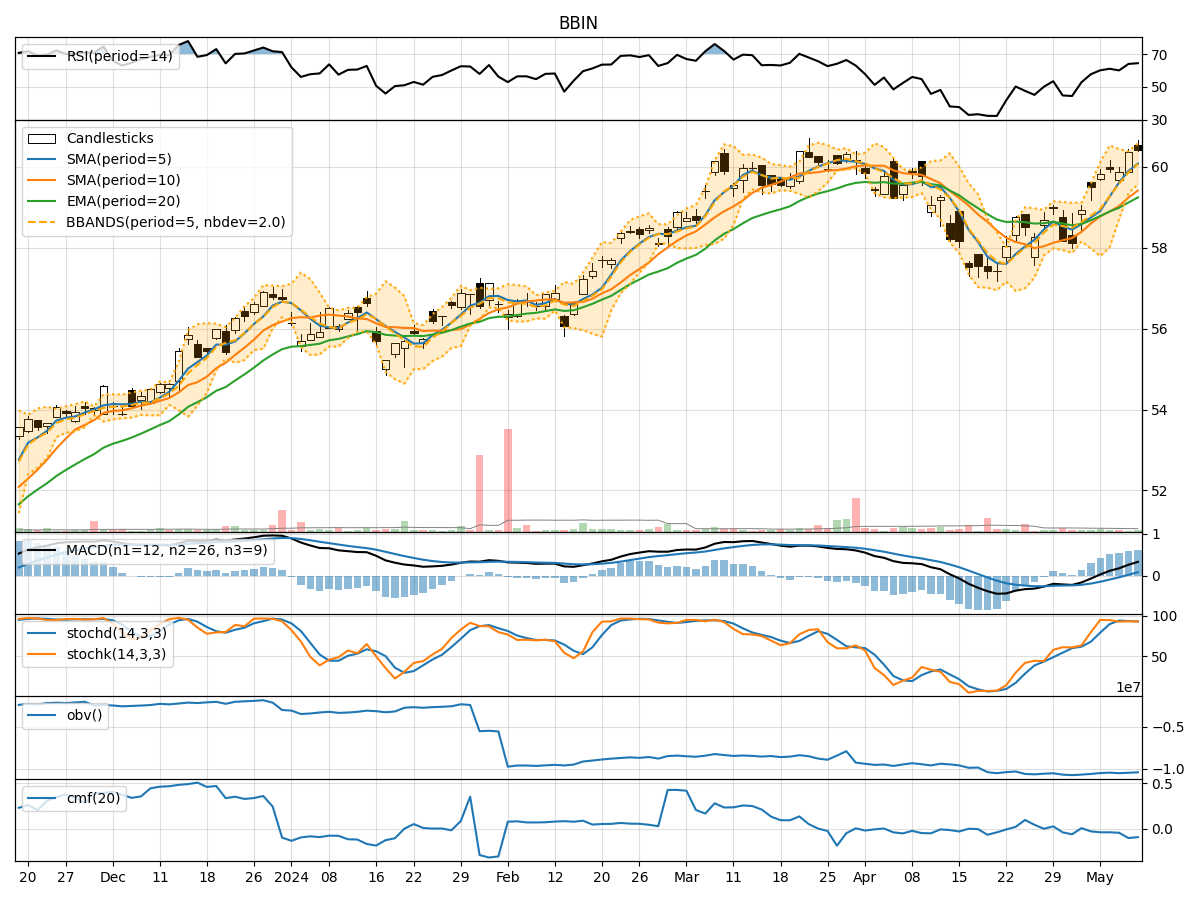
- Moving Averages (MA): The 5-day Moving Average (MA) has been consistently above the Simple Moving Average (SMA) and Exponential Moving Average (EMA), indicating a bullish trend.
- MACD: The MACD line has been consistently above the signal line, with increasing values, suggesting a strengthening bullish momentum.
- RSI: The Relative Strength Index (RSI) has been consistently above 50, indicating bullish momentum.
Key Observation: The trend indicators suggest a strong bullish sentiment in the stock.
Momentum Analysis:
- Stochastic Oscillator: Both %K and %D have been consistently high, indicating strong buying pressure.
- Williams %R: The Williams %R has been consistently in the oversold territory, suggesting a potential reversal.
Key Observation: Momentum indicators reflect a strong buying pressure and a possible reversal in the near term.
Volatility Analysis:
- Bollinger Bands (BB): The stock price has been consistently trading above the middle Bollinger Band, indicating an uptrend.
- Bollinger %B: The %B value has been above 0.5, indicating bullish momentum.
Key Observation: Volatility indicators suggest an uptrend with bullish momentum.
Volume Analysis:
- On-Balance Volume (OBV): The OBV has been consistently negative, indicating distribution.
- Chaikin Money Flow (CMF): The CMF has been consistently negative, suggesting selling pressure.
Key Observation: Volume indicators indicate selling pressure and distribution in the stock.
Conclusion:
Based on the analysis of trend, momentum, volatility, and volume indicators, the overall outlook for BBIN stock is bullish in the short term. The strong bullish trend, positive momentum, and volatility indicators support a potential upward movement in the stock price. However, the negative volume indicators raise some concerns about the sustainability of the bullish trend.
Recommendation: Considering the overall bullish sentiment but being cautious of the selling pressure indicated by volume indicators, investors may consider entering long positions with tight stop-loss levels to manage risk effectively. Monitoring the volume closely for any signs of reversal is crucial in this scenario.
In conclusion, the next few days may see upward movement in BBIN stock price, driven by the prevailing bullish trend and positive momentum.