Technical Analysis of BBLB 2024-05-10
Overview:
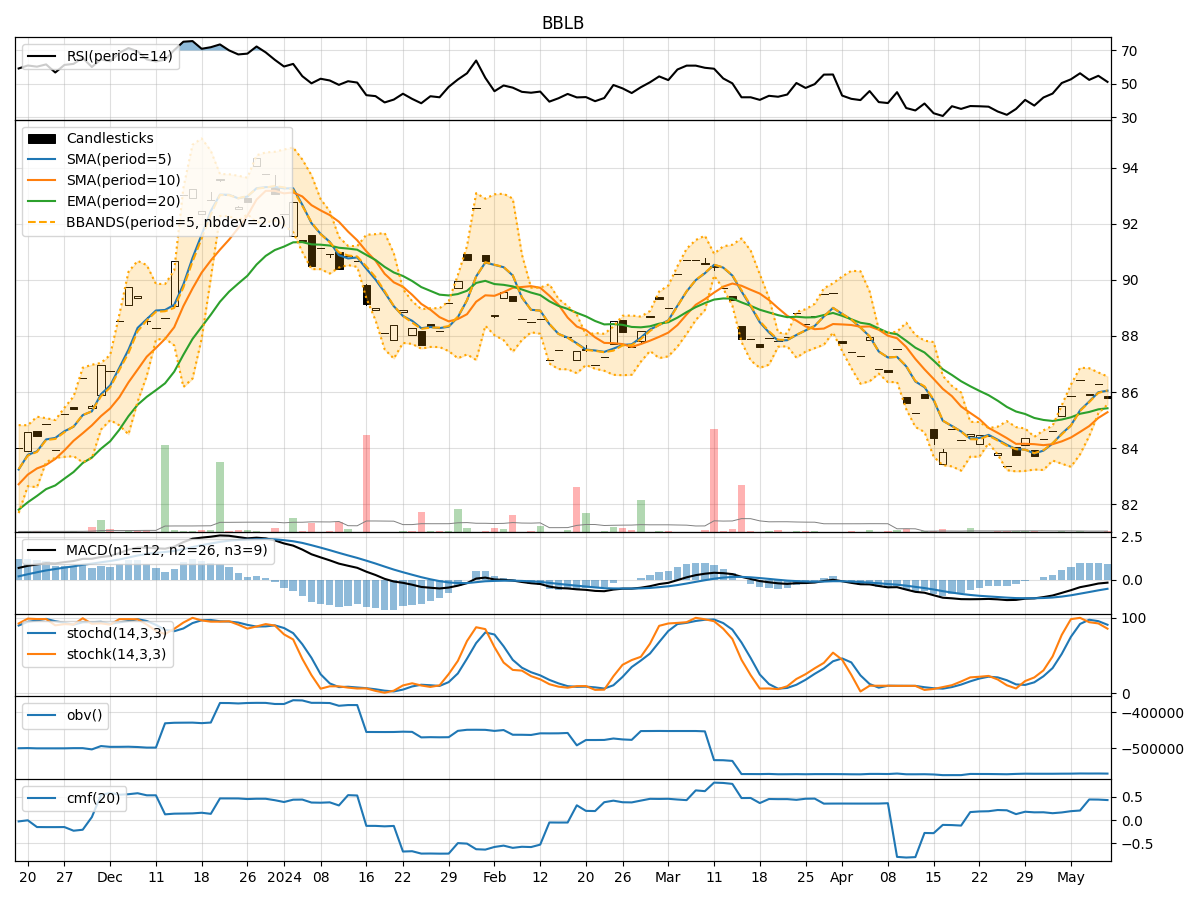
In analyzing the technical indicators for BBLB over the last 5 days, we will delve into the trend, momentum, volatility, and volume indicators to provide a comprehensive outlook on the possible stock price movement in the coming days. By examining these key indicators, we aim to offer valuable insights and predictions for informed decision-making.
Trend Analysis:
- Moving Averages (MA): The 5-day Moving Average (MA) has been showing an upward trend, indicating a positive momentum in the stock price.
- MACD: The Moving Average Convergence Divergence (MACD) has been consistently positive, suggesting a bullish trend in the stock.
- EMA: The Exponential Moving Average (EMA) has been steadily increasing, supporting the bullish sentiment in the stock.
Key Observation: The trend indicators point towards an upward trajectory in the stock price.
Momentum Analysis:
- RSI: The Relative Strength Index (RSI) has been fluctuating around the neutral zone, indicating a balanced momentum in the stock.
- Stochastic Oscillator: Both %K and %D values have been declining, suggesting a potential reversal in momentum.
- Williams %R: The Williams %R is in the oversold territory, signaling a possible buying opportunity.
Key Observation: The momentum indicators reflect a neutral to slightly bearish sentiment in the stock.
Volatility Analysis:
- Bollinger Bands (BB): The Bollinger Bands have been narrowing, indicating decreasing volatility in the stock.
- BB %B: The %B value is relatively low, suggesting a potential consolidation phase.
- BB Width: The Bollinger Bands Width is contracting, signaling a period of reduced price fluctuations.
Key Observation: The volatility indicators imply a consolidation phase in the stock.
Volume Analysis:
- On-Balance Volume (OBV): The OBV has been fluctuating, indicating mixed buying and selling pressure.
- Chaikin Money Flow (CMF): The CMF has been positive, suggesting inflow of money into the stock.
Key Observation: The volume indicators depict a mixed sentiment in the stock.
Conclusion:
Based on the analysis of the technical indicators, the stock of BBLB is likely to experience a sideways movement in the coming days. The trend indicators support an upward trajectory, while the momentum indicators suggest a neutral to slightly bearish sentiment. The volatility indicators point towards a consolidation phase, and the volume indicators indicate a mixed sentiment.
Overall, the stock is expected to trade within a range with a potential for a slight upward bias. Traders may consider waiting for clearer signals before taking significant positions.