Technical Analysis of BBLU 2024-05-10
Overview:
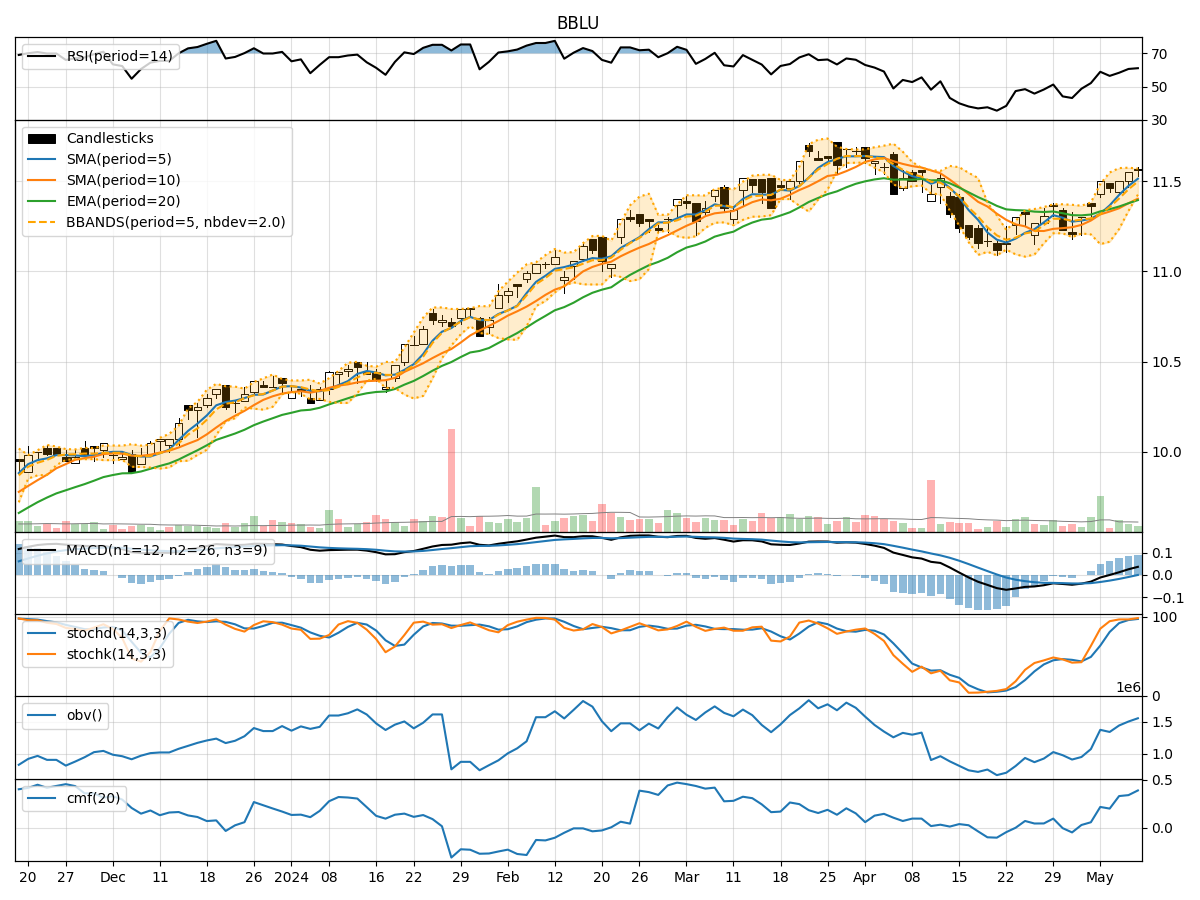
In analyzing the technical indicators for BBLU over the last 5 days, we will delve into the trend, momentum, volatility, and volume indicators to provide a comprehensive outlook on the possible stock price movement. By examining these key aspects, we aim to offer valuable insights and recommendations for potential investors.
Trend Analysis:
- Moving Averages (MA): The 5-day Moving Average (MA) has been consistently above the Simple Moving Average (SMA) and Exponential Moving Average (EMA), indicating a bullish trend.
- MACD: The MACD line has been consistently above the signal line, with the MACD histogram showing an increasing positive trend, suggesting bullish momentum.
Momentum Analysis:
- RSI: The Relative Strength Index (RSI) has been fluctuating around the 60-70 range, indicating a neutral to slightly bullish momentum.
- Stochastic Oscillator: Both %K and %D have been in the overbought territory, suggesting a potential reversal or consolidation.
Volatility Analysis:
- Bollinger Bands (BB): The stock price has been trading within the Bollinger Bands, with the bands narrowing, indicating decreasing volatility.
- Bollinger Percent (BBP): The BBP has been gradually increasing, suggesting a potential breakout or continuation of the current trend.
Volume Analysis:
- On-Balance Volume (OBV): The OBV has been steadily increasing, indicating accumulation by investors.
- Chaikin Money Flow (CMF): The CMF has been positive, reflecting buying pressure in the stock.
Key Observations:
- The trend indicators suggest a strong bullish sentiment, supported by the MACD and moving averages.
- Momentum indicators show a neutral to slightly bullish momentum, with the stochastic oscillator signaling a potential reversal.
- Volatility has been decreasing, as indicated by the narrowing Bollinger Bands.
- Volume indicators point towards accumulation and buying pressure in the stock.
Conclusion:
Based on the analysis of the technical indicators, the next few days' possible stock price movement for BBLU is likely to continue in an upward direction. The bullish trend supported by the moving averages and MACD, coupled with positive volume indicators, indicates a favorable outlook for the stock. However, caution is advised as the stochastic oscillator suggests a potential reversal, and investors should monitor the price action closely for any signs of consolidation or a trend reversal.