Technical Analysis of BBMC 2024-05-10
Overview:
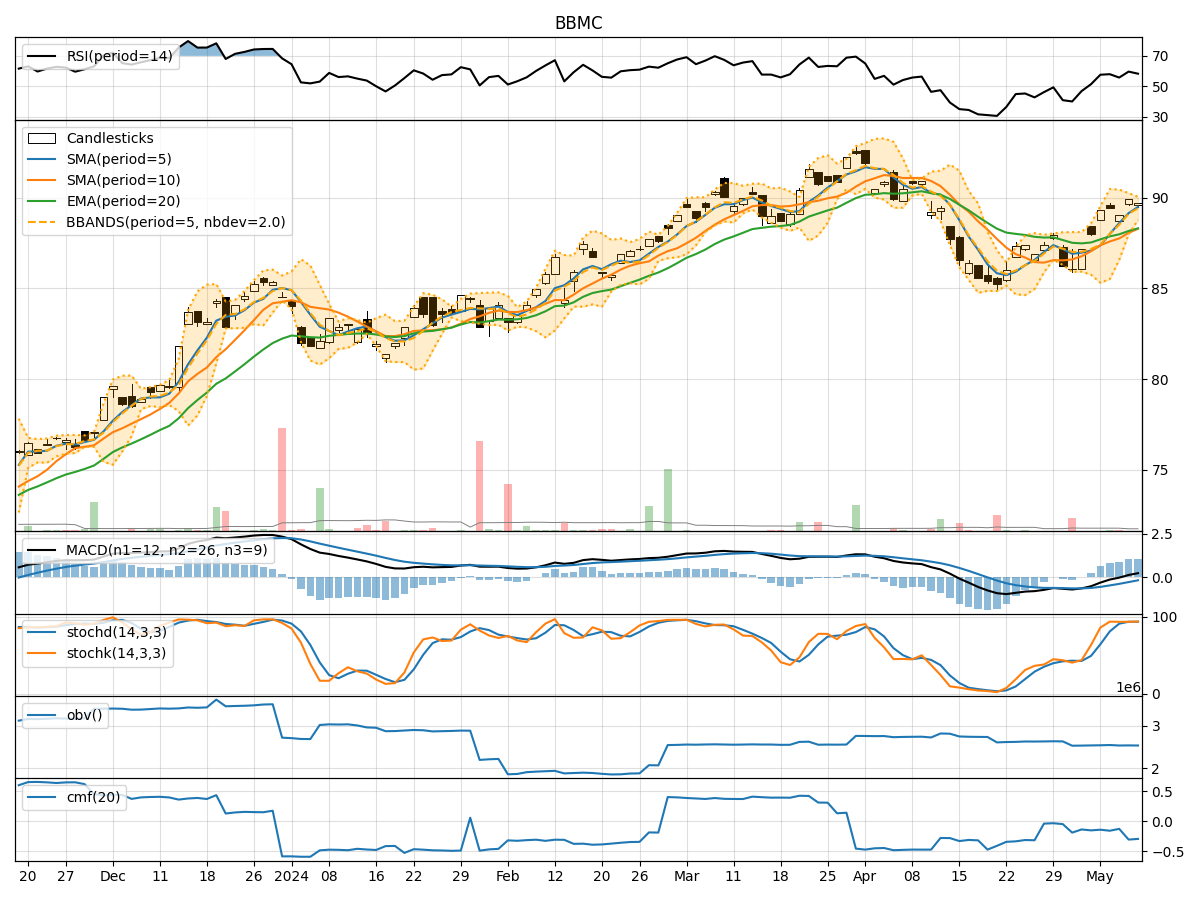
In analyzing the technical indicators for BBMC stock over the last 5 days, we will delve into the trend, momentum, volatility, and volume indicators to provide a comprehensive outlook on the possible stock price movement in the coming days. By examining these key indicators, we aim to offer valuable insights and predictions for potential investors and traders.
Trend Indicators:
- Moving Averages (MA): The 5-day Moving Average (MA) has been consistently above the Simple Moving Average (SMA) and Exponential Moving Average (EMA), indicating a bullish trend.
- MACD: The Moving Average Convergence Divergence (MACD) has shown positive values, with the MACD line consistently above the Signal line, suggesting bullish momentum.
- MACD Histogram: The MACD Histogram has been increasing, indicating strengthening bullish momentum.
Momentum Indicators:
- RSI: The Relative Strength Index (RSI) has been fluctuating around the 50 level, indicating a neutral momentum.
- Stochastic Oscillator: Both %K and %D lines of the Stochastic Oscillator have been in the overbought zone, suggesting a potential reversal.
- Williams %R: The Williams %R has been hovering around the oversold territory, indicating a possible buying opportunity.
Volatility Indicators:
- Bollinger Bands: The Bollinger Bands have been narrowing, suggesting decreasing volatility in the stock price.
- Bollinger %B: The %B indicator has been fluctuating within a tight range, indicating a period of consolidation.
- Bollinger Band Width: The Band Width has been decreasing, signaling a potential breakout or significant price movement ahead.
Volume Indicators:
- On-Balance Volume (OBV): The OBV has shown mixed signals, indicating indecision among market participants.
- Chaikin Money Flow (CMF): The CMF has been negative, suggesting selling pressure in the stock.
Key Observations and Opinions:
- Trend: The trend indicators suggest a bullish bias in the stock price.
- Momentum: Momentum indicators show mixed signals, with a potential reversal in the stochastic oscillator.
- Volatility: Volatility indicators point towards a period of consolidation and a potential breakout.
- Volume: Volume indicators reflect indecision among investors, with selling pressure indicated by CMF.
Conclusion:
Based on the analysis of the technical indicators, the stock price of BBMC is likely to experience sideways consolidation in the coming days. Investors should closely monitor the stochastic oscillator for a potential reversal signal and the Bollinger Bands for a breakout confirmation. It is advisable to wait for more clarity in market dynamics before making significant trading decisions.