Technical Analysis of BBP 2024-05-10
Overview:
In analyzing the provided technical indicators for the last 5 days, we will delve into the trend, momentum, volatility, and volume indicators to gain a comprehensive understanding of the stock's potential price movement. By examining these key factors, we aim to provide insights and predictions for the next few days of trading.
Trend Indicators:
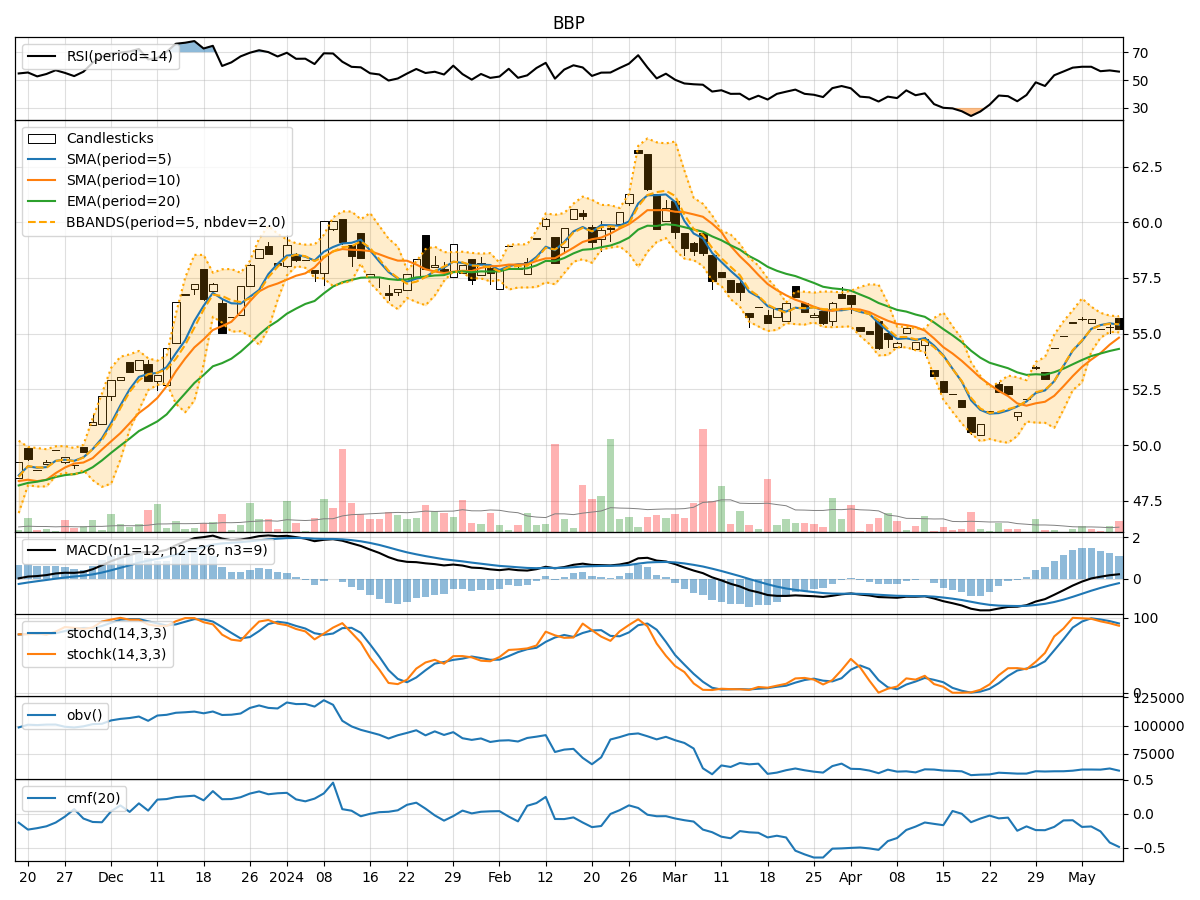
- Moving Averages (MA): The 5-day MA has been consistently above the 10-day SMA, indicating a short-term bullish trend. The EMA(20) has been steadily increasing, reflecting positive momentum.
- MACD: The MACD line has been above the signal line for the past 5 days, suggesting bullish momentum.
- MACD Histogram: The MACD Histogram has been consistently above the zero line, indicating increasing bullish momentum.
Momentum Indicators:
- RSI: The RSI has been fluctuating around the 50 level, indicating a neutral stance in momentum.
- Stochastic Oscillator: Both %K and %D have been declining, signaling a potential shift towards oversold conditions.
- Williams %R: The Williams %R has been in the oversold territory, suggesting a possible reversal in momentum.
Volatility Indicators:
- Bollinger Bands (BB): The stock price has been trading within the Bollinger Bands, with the %B indicator hovering around the middle range, indicating moderate volatility.
- Bollinger Band Width: The Band Width has been relatively stable, suggesting a lack of significant price expansion or contraction.
Volume Indicators:
- On-Balance Volume (OBV): The OBV has been fluctuating, indicating mixed buying and selling pressure.
- Chaikin Money Flow (CMF): The CMF has been negative, reflecting a net outflow of money from the stock.
Key Observations and Opinions:
- Trend: The stock is currently in an upward trend based on the moving averages and MACD indicators.
- Momentum: Momentum indicators suggest a neutral to slightly bearish bias with potential oversold conditions.
- Volatility: Volatility remains moderate with no significant price movements outside the Bollinger Bands.
- Volume: The volume indicators show mixed signals with fluctuating OBV and negative CMF.
Conclusion:
Based on the analysis of the technical indicators, the stock is likely to experience sideways consolidation in the next few days. While the trend remains bullish, the momentum indicators suggest a potential shift towards oversold conditions. Volatility is expected to remain moderate, and the volume indicators indicate mixed buying and selling pressure. Therefore, it is advisable to exercise caution and closely monitor the price action for any potential reversals or breakout opportunities.