Technical Analysis of BBRE 2024-05-10
Overview:
In analyzing the technical indicators for BBRE stock over the last 5 days, we will delve into the trend, momentum, volatility, and volume indicators to provide a comprehensive outlook on the possible future stock price movement. By examining these key indicators, we aim to offer valuable insights and predictions for the upcoming trading days.
Trend Analysis:
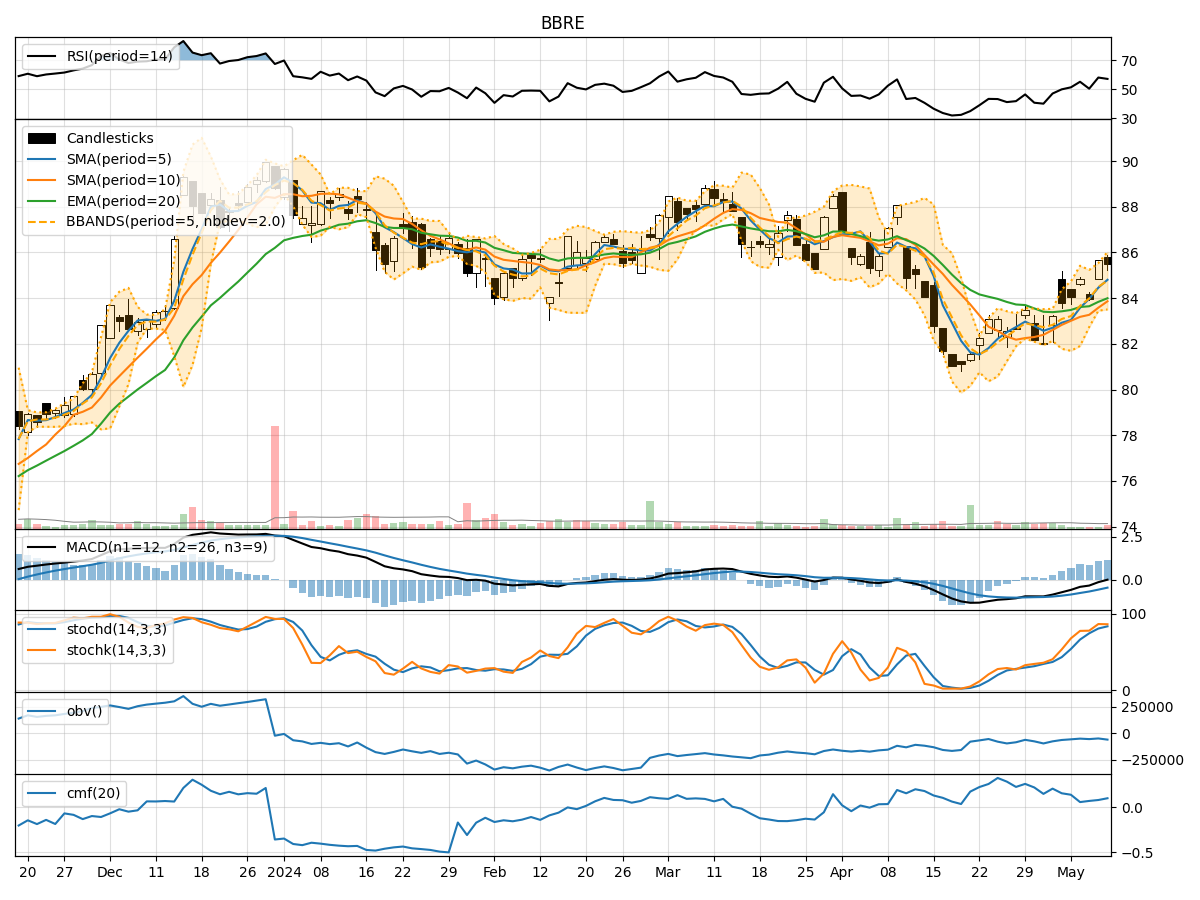
- Moving Averages (MA): The 5-day Moving Average (MA) has been trending above the Simple Moving Average (SMA) and Exponential Moving Average (EMA) over the past 5 days, indicating a bullish trend.
- MACD: The Moving Average Convergence Divergence (MACD) has shown positive values, with the MACD line consistently above the Signal line, suggesting bullish momentum.
- Conclusion: The trend indicators point towards an upward trend for BBRE stock.
Momentum Analysis:
- RSI: The Relative Strength Index (RSI) has been fluctuating around the mid-level, indicating a neutral momentum.
- Stochastic Oscillator: Both %K and %D values have been in the overbought territory, suggesting a potential reversal.
- Conclusion: The momentum indicators suggest a neutral to slightly bearish momentum for BBRE stock.
Volatility Analysis:
- Bollinger Bands (BB): The stock price has mostly remained within the Bollinger Bands, with the bands widening slightly, indicating increased volatility.
- Conclusion: The volatility indicators signal increased volatility in the stock price of BBRE.
Volume Analysis:
- On-Balance Volume (OBV): The OBV has shown a slight increase over the last 5 days, indicating a positive volume flow.
- Chaikin Money Flow (CMF): The CMF has been positive, reflecting buying pressure in the stock.
- Conclusion: The volume indicators suggest positive volume flow and buying interest in BBRE stock.
Overall Conclusion:
Based on the analysis of trend, momentum, volatility, and volume indicators, the overall outlook for BBRE stock in the next few days is as follows: - Trend: The trend indicators point towards an upward trend. - Momentum: The momentum indicators suggest a neutral to slightly bearish momentum. - Volatility: Increased volatility is expected in the stock price. - Volume: Positive volume flow and buying interest are observed.
Final Recommendation:
Considering the overall analysis, it is likely that BBRE stock will experience upward movement in the next few days, supported by the bullish trend indicators. However, caution is advised due to the neutral to slightly bearish momentum and increased volatility. Traders and investors should closely monitor the price action and key support/resistance levels for timely decision-making.
Disclaimer:
This analysis is based solely on technical indicators and historical data, and actual market movements may vary. It is essential to consider other factors and conduct thorough research before making any investment decisions. Consulting with a financial advisor is recommended for personalized investment advice tailored to individual risk tolerance and financial goals.