Technical Analysis of BBSA 2024-05-10
Overview:
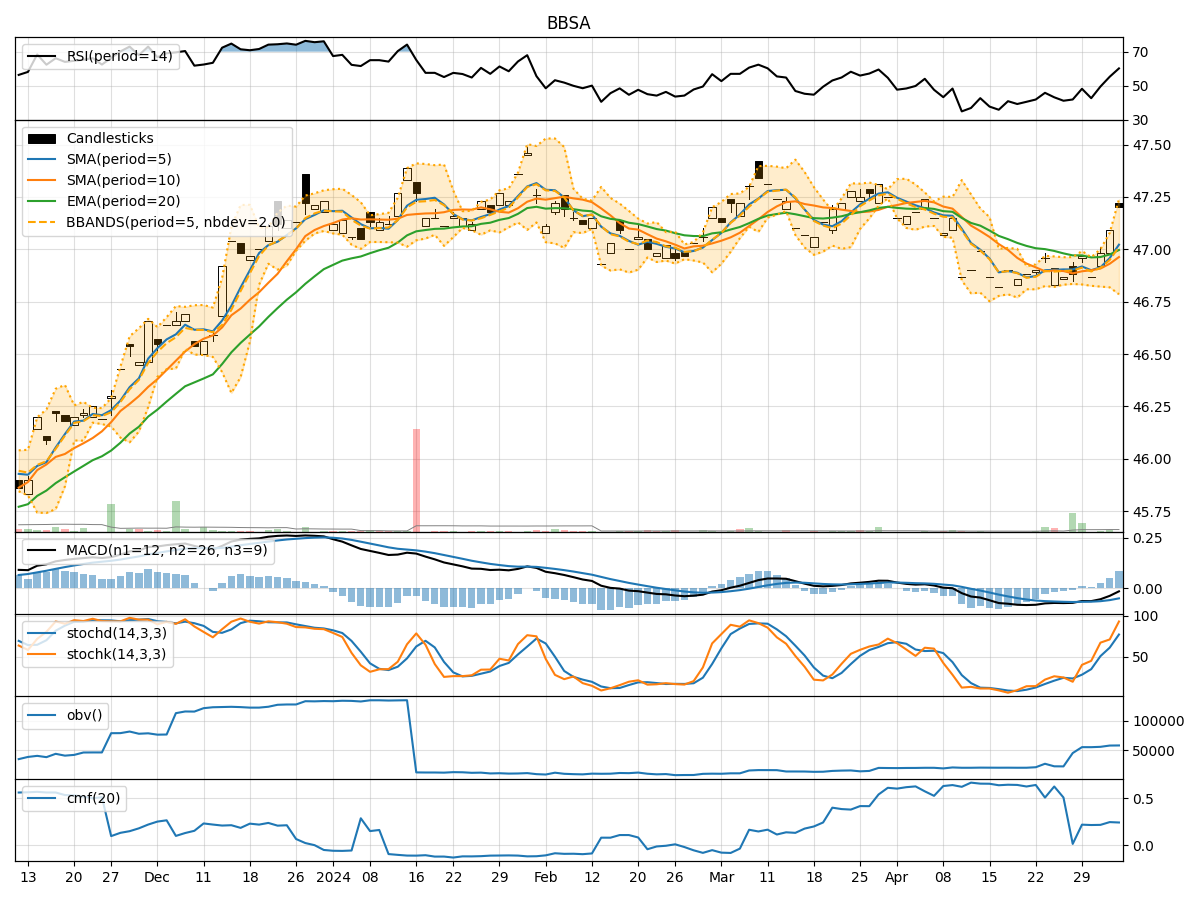
In analyzing the technical indicators for BBSA stock over the last 5 days, we will delve into the trend, momentum, volatility, and volume indicators to provide a comprehensive outlook on the possible stock price movement in the coming days. By examining these key aspects, we aim to offer valuable insights and predictions for informed decision-making.
Trend Indicators:
- Moving Averages (MA): The 5-day Moving Average (MA) has been consistently above the Simple Moving Average (SMA) and Exponential Moving Average (EMA), indicating a bullish trend.
- MACD: The MACD line has been above the signal line, with both lines showing an upward trend, suggesting positive momentum.
Momentum Indicators:
- RSI: The Relative Strength Index (RSI) has been fluctuating around the overbought territory, indicating strong buying momentum.
- Stochastic Oscillator: Both %K and %D have been relatively high, suggesting bullish momentum.
Volatility Indicators:
- Bollinger Bands (BB): The stock price has been trading within the Bollinger Bands, with the bands narrowing, indicating decreased volatility.
Volume Indicators:
- On-Balance Volume (OBV): The OBV has shown mixed movements, reflecting indecision among investors.
- Chaikin Money Flow (CMF): The CMF has been positive, indicating buying pressure in the market.
Key Observations and Opinions:
- Trend: The stock is in an upward trend based on moving averages and MACD.
- Momentum: Momentum indicators suggest bullish momentum with RSI in the overbought zone and Stochastic Oscillator showing strength.
- Volatility: Volatility has been decreasing as seen in the narrowing Bollinger Bands.
- Volume: Volume indicators show mixed signals, with OBV not confirming the price movement and CMF indicating buying pressure.
Conclusion:
Based on the analysis of the technical indicators, the next few days for BBSA stock are likely to see continued upward movement. The bullish trend, positive momentum, decreasing volatility, and some buying pressure indicated by volume indicators suggest that the stock price is poised to rise further. Traders and investors may consider buying opportunities in anticipation of potential price appreciation.
Disclaimer:
Remember that technical analysis is not a guaranteed predictor of future price movements, and other fundamental factors can influence stock prices. It is essential to conduct thorough research and consider multiple indicators before making investment decisions. Consulting with a financial advisor is recommended for personalized guidance tailored to individual investment goals and risk tolerance levels.