Technical Analysis of BBSC 2024-05-10
Overview:
In analyzing the provided technical indicators for the last 5 days, we will delve into the trend, momentum, volatility, and volume indicators to forecast the possible stock price movement for the next few days. By examining these key aspects, we aim to provide a comprehensive and insightful analysis to guide your decision-making process.
Trend Indicators:
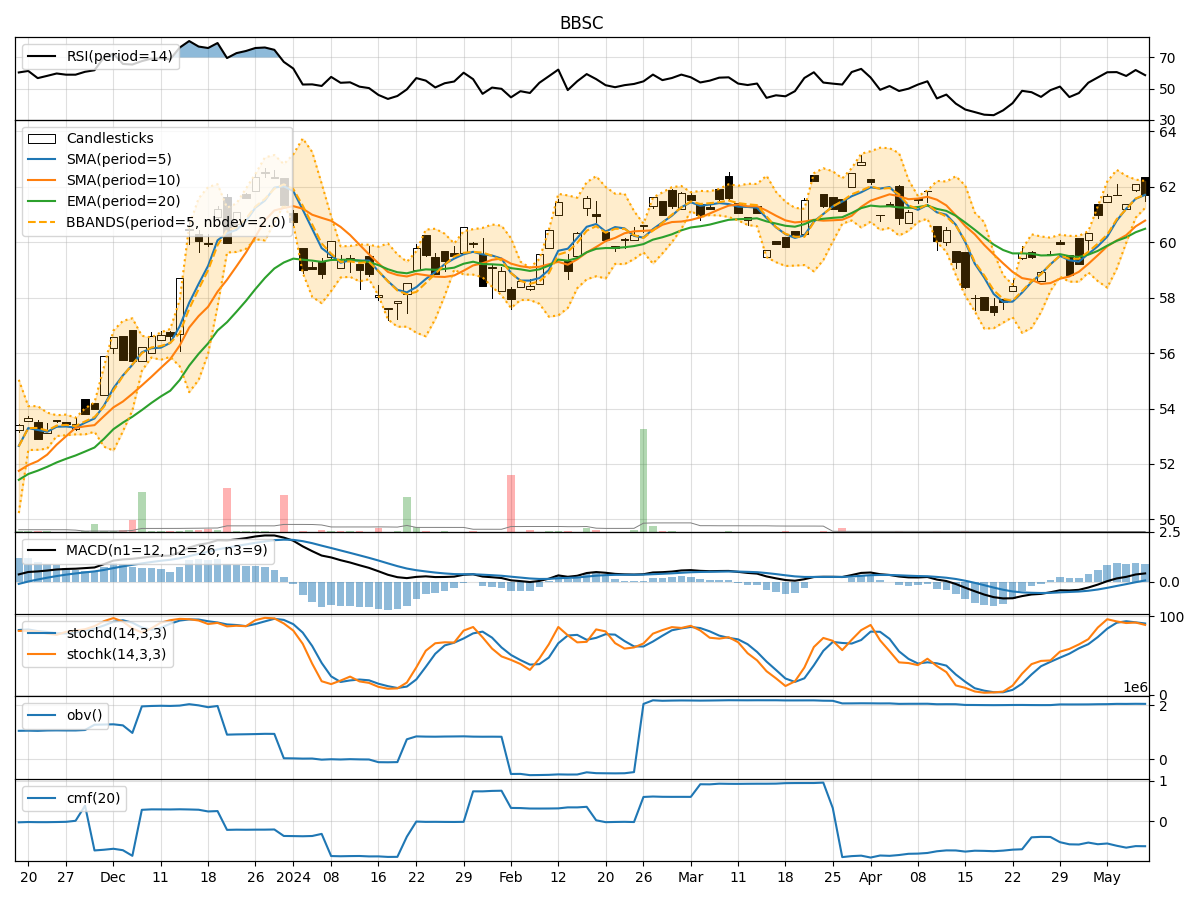
- Moving Averages (MA): The 5-day MA has been consistently above the 10-day SMA and 20-day EMA, indicating a short-term bullish trend.
- MACD: The MACD line has been above the signal line for the past few days, suggesting positive momentum.
- MACD Histogram: The histogram has shown an increasing trend, indicating strengthening bullish momentum.
Momentum Indicators:
- RSI: The RSI has been fluctuating but generally staying within the overbought territory, suggesting a strong bullish momentum.
- Stochastic Oscillator: Both %K and %D have been relatively high, indicating an overbought condition.
- Williams %R: The indicator has been consistently in the oversold region, signaling a potential reversal.
Volatility Indicators:
- Bollinger Bands (BB): The stock price has been trading within the bands, with the upper band acting as resistance and the lower band as support.
- Bollinger %B: The %B indicator has been fluctuating around the midline, indicating a neutral stance.
- Bollinger Band Width: The band width has been narrowing, suggesting a potential decrease in volatility.
Volume Indicators:
- On-Balance Volume (OBV): The OBV has been relatively stable, indicating a balance between buying and selling pressure.
- Chaikin Money Flow (CMF): The CMF has been negative, suggesting a net outflow of money from the stock.
Key Observations and Opinions:
- Trend: The stock is currently in an upward trend based on moving averages and MACD analysis.
- Momentum: Momentum indicators suggest a strong bullish sentiment but also indicate an overbought condition.
- Volatility: Bollinger Bands show a narrowing range, signaling a potential decrease in volatility.
- Volume: The volume indicators reflect a balanced market sentiment with a slight negative bias.
Conclusion:
Based on the analysis of the technical indicators, the next few days' possible stock price movement is likely to be sideways with a slight bullish bias. While the trend and momentum indicators point towards a continuation of the upward trend, the overbought conditions and negative CMF signal caution. Traders should closely monitor key support and resistance levels within the Bollinger Bands for potential entry and exit points.