Technical Analysis of BBUS 2024-05-10
Overview:
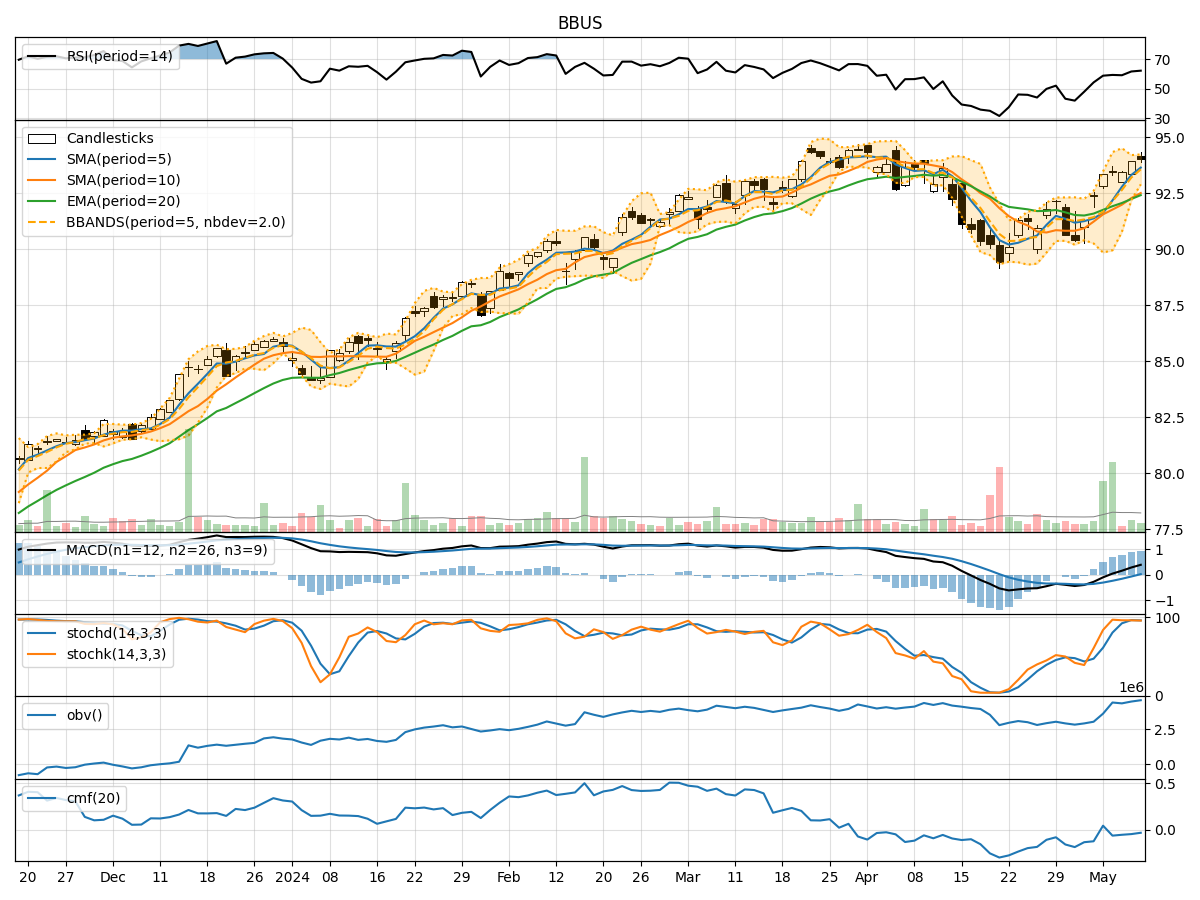
In analyzing the technical indicators for BBUS over the last 5 days, we will delve into the trend, momentum, volatility, and volume indicators to provide a comprehensive outlook on the possible stock price movement. By examining these key aspects, we aim to offer valuable insights and predictions for the upcoming days.
Trend Indicators:
- Moving Averages (MA): The 5-day Moving Average has been consistently above the Simple Moving Average (SMA) and Exponential Moving Average (EMA), indicating a bullish trend.
- MACD: The MACD line has been above the signal line, with both lines showing an upward trend, suggesting bullish momentum.
- MACD Histogram: The MACD Histogram has been increasing over the last 5 days, indicating strengthening bullish momentum.
Momentum Indicators:
- RSI: The Relative Strength Index (RSI) has been trending upwards, reaching levels above 50, indicating increasing buying pressure.
- Stochastic Oscillator: Both %K and %D lines of the Stochastic Oscillator have been in the overbought zone, suggesting a potential reversal or consolidation.
- Williams %R: The Williams %R has been fluctuating in the oversold and overbought zones, indicating mixed momentum.
Volatility Indicators:
- Bollinger Bands (BB): The stock price has been trading within the upper Bollinger Band (BBU), suggesting an overbought condition.
- Bollinger Band Width (BBW): The Band Width has been narrowing, indicating decreasing volatility.
- Bollinger Band %B (BBP): The %B indicator has been above 0.8, signaling a potential overbought condition.
Volume Indicators:
- On-Balance Volume (OBV): The OBV has shown a slight increase over the last 5 days, indicating some accumulation.
- Chaikin Money Flow (CMF): The CMF has been negative, suggesting outflow of money from the stock.
Key Observations and Opinions:
- Trend: The trend indicators suggest a strong bullish sentiment in the short term.
- Momentum: While the RSI indicates buying pressure, the Stochastic Oscillator and Williams %R suggest a potential reversal or consolidation.
- Volatility: The narrowing Bollinger Band Width and high %B indicate a possible decrease in volatility and an overbought condition.
- Volume: The slight increase in OBV contradicts the negative CMF, indicating mixed sentiment among investors.
Conclusion:
Based on the analysis of the technical indicators, the stock price of BBUS is likely to experience a short-term consolidation or pullback in the upcoming days. The overbought conditions suggested by the Stochastic Oscillator and Bollinger Bands, combined with the negative CMF, indicate a potential reversal in momentum. Traders should exercise caution and consider taking profits or implementing risk management strategies in anticipation of a possible downward movement.