Technical Analysis of BCD 2024-05-10
Overview:
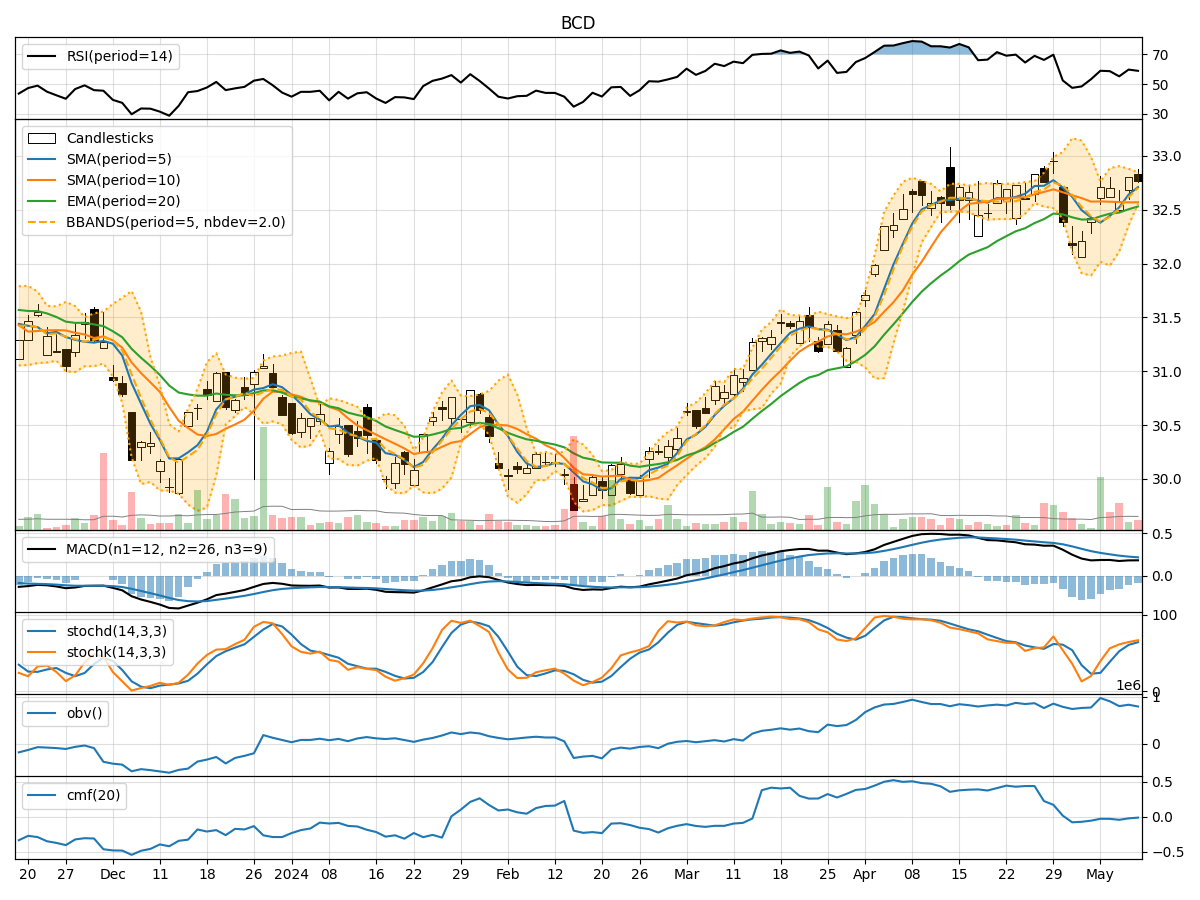
In analyzing the technical indicators for BCD stock over the last 5 days, we will delve into the trends, momentum, volatility, and volume aspects to provide a comprehensive outlook on the possible future stock price movement. By examining key indicators such as moving averages, MACD, RSI, Bollinger Bands, and OBV, we aim to offer valuable insights and recommendations for potential trading strategies.
Trend Analysis:
- Moving Averages (MA): The 5-day moving average has been consistently above the closing prices, indicating a short-term uptrend.
- MACD: The MACD line has been positive, suggesting bullish momentum in the stock.
- EMA: The exponential moving average has been trending upwards, reflecting a positive price trend.
Momentum Analysis:
- RSI: The Relative Strength Index has been hovering around 60, indicating a neutral to slightly bullish momentum.
- Stochastic Oscillator: Both %K and %D have been in the overbought zone, signaling potential for a pullback.
- Williams %R: The Williams %R is in the oversold territory, suggesting a possible reversal in the short term.
Volatility Analysis:
- Bollinger Bands: The stock price has been trading within the Bollinger Bands, indicating a period of consolidation.
- Bollinger %B: The %B indicator is below 1, suggesting the stock is trading below the upper Bollinger Band.
Volume Analysis:
- On-Balance Volume (OBV): The OBV has been declining, indicating selling pressure in the stock.
- Chaikin Money Flow (CMF): The CMF has been negative, reflecting a lack of buying interest in the stock.
Key Observations:
- The stock is currently in a short-term uptrend based on moving averages and MACD.
- Momentum indicators suggest a mixed outlook with potential for a pullback or reversal.
- Volatility is low, indicating a period of consolidation.
- Volume indicators show a lack of significant buying interest.
Conclusion:
Based on the analysis of technical indicators, the stock is likely to experience a period of consolidation in the near term. While the short-term trend is bullish, the momentum indicators suggest a potential for a pullback. Traders should exercise caution and consider waiting for clearer signals before making significant trading decisions. It is advisable to monitor key support and resistance levels for potential entry or exit points.