Technical Analysis of BCDF 2024-05-10
Overview:
In analyzing the technical indicators for BCDF stock over the last 5 days, we will delve into the trend, momentum, volatility, and volume indicators to provide a comprehensive outlook on the possible stock price movement in the coming days. By examining these key indicators, we aim to offer valuable insights and predictions for potential investors.
Trend Indicators:
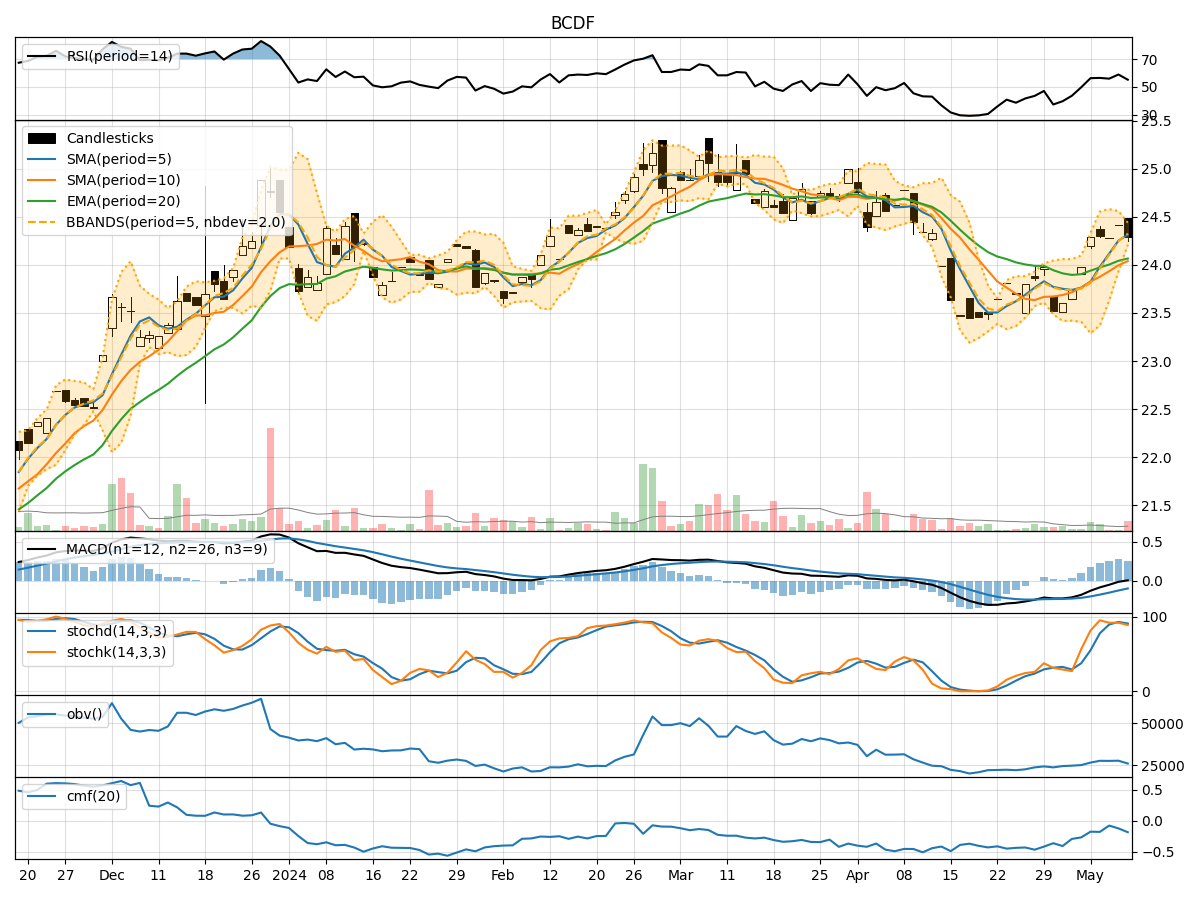
- Moving Averages (MA): The 5-day MA has been consistently above the closing prices, indicating a short-term uptrend.
- MACD: The MACD line has been gradually increasing, with the MACD histogram showing positive values, suggesting bullish momentum.
- Relative Strength Index (RSI): The RSI has been fluctuating around the 50 level, indicating a neutral stance in terms of momentum.
Momentum Indicators:
- Stochastic Oscillator: The Stochastic Oscillator has been hovering in the overbought territory, suggesting a potential reversal or consolidation.
- Williams %R (WillR): The WillR indicator has been in the oversold region, signaling a possible buying opportunity.
Volatility Indicators:
- Bollinger Bands (BB): The narrowing of the Bollinger Bands suggests decreasing volatility and a potential period of consolidation.
- Average True Range (ATR): The ATR has been decreasing, indicating a decline in price volatility.
Volume Indicators:
- On-Balance Volume (OBV): The OBV has shown mixed movements, reflecting indecision among market participants.
- Chaikin Money Flow (CMF): The CMF has been negative, indicating selling pressure in the stock.
Key Observations and Opinions:
- Trend: The stock is currently in an upward trend based on the moving averages and MACD indicators.
- Momentum: The Stochastic Oscillator and Williams %R suggest a potential reversal or consolidation in the short term.
- Volatility: The Bollinger Bands and ATR point towards a period of consolidation with decreasing volatility.
- Volume: The OBV and CMF indicate mixed sentiment among investors, with a slight bias towards selling pressure.
Conclusion:
Based on the analysis of the technical indicators, the next few days for BCDF stock are likely to see sideways movement with a slight bias towards consolidation. Investors should closely monitor the Stochastic Oscillator and Williams %R for potential reversal signals, while also keeping an eye on the OBV and CMF for any shifts in sentiment. Overall, a cautious approach is recommended until clearer trends emerge in the market dynamics.