Technical Analysis of BCHP 2024-05-10
Overview:
In analyzing the technical indicators for BCHP over the last 5 days, we will delve into the trend, momentum, volatility, and volume indicators to provide a comprehensive outlook on the possible stock price movement in the coming days. By examining these key indicators, we aim to offer valuable insights and predictions for potential investors and traders.
Trend Analysis:
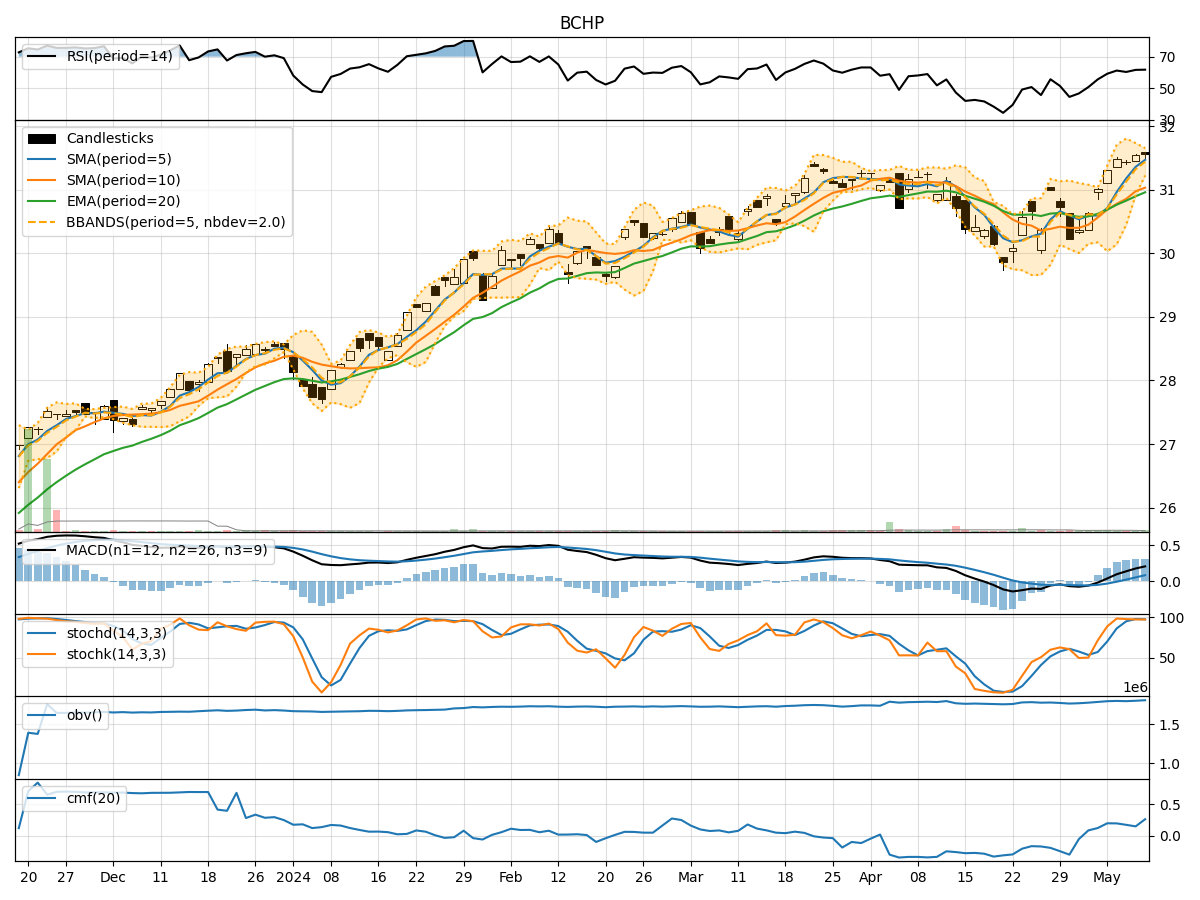
- Moving Averages (MA): The 5-day Moving Average (MA) has been consistently above the Simple Moving Average (SMA) and Exponential Moving Average (EMA), indicating a bullish trend.
- MACD: The MACD line has been consistently above the signal line, with the MACD histogram showing an increasing positive trend, suggesting strong bullish momentum.
Momentum Analysis:
- RSI: The Relative Strength Index (RSI) has been hovering around 60-62, indicating a neutral to slightly bullish momentum.
- Stochastic Oscillator: Both %K and %D lines of the Stochastic Oscillator have been in the overbought zone, suggesting a potential reversal or consolidation.
Volatility Analysis:
- Bollinger Bands (BB): The stock price has been trading within the upper Bollinger Band (BBU), indicating an overbought condition.
- Bollinger %B (BBP): The %B value has been decreasing, suggesting a potential reversal or consolidation in the price.
Volume Analysis:
- On-Balance Volume (OBV): The OBV has shown a slight increase over the last 5 days, indicating some accumulation by investors.
- Chaikin Money Flow (CMF): The CMF has been fluctuating around 0.15-0.26, indicating moderate buying pressure.
Conclusion:
Based on the analysis of the technical indicators, the stock price of BCHP is likely to experience a short-term consolidation or pullback in the coming days. The bullish trend indicated by the moving averages and MACD may face resistance due to the overbought conditions highlighted by the Stochastic Oscillator and Bollinger Bands. The neutral RSI and fluctuating CMF further support the view of a potential price correction.
Recommendation:
- Short-term Traders: Consider taking profits or setting tight stop-loss orders to protect gains during the expected consolidation phase.
- Long-term Investors: Use the potential pullback as an opportunity to accumulate more shares at lower prices, considering the overall bullish trend in the stock.
Disclaimer:
Remember that market conditions can change rapidly, and it is essential to monitor the stock closely for any new developments or signals that may alter the current outlook. Always consider your risk tolerance and investment goals before making any trading decisions.