Technical Analysis of BCI 2024-05-10
Overview:
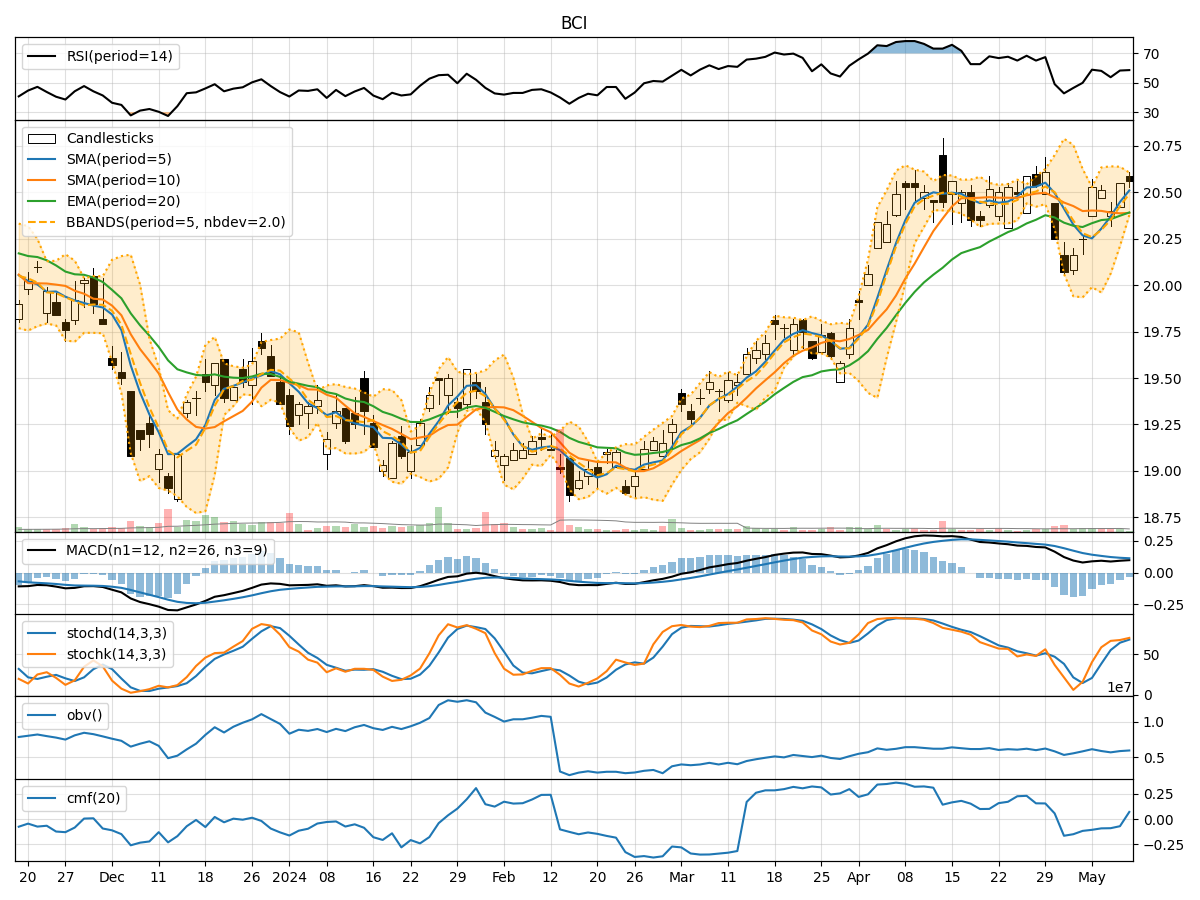
In analyzing the technical indicators for BCI stock over the last 5 days, we will delve into the trend, momentum, volatility, and volume indicators to forecast the possible stock price movement in the upcoming days. By examining these key indicators, we aim to provide a comprehensive and insightful analysis to guide your investment decisions.
Trend Analysis:
- Moving Averages (MA): The 5-day Moving Average (MA) has been consistently above the closing prices, indicating a short-term uptrend.
- MACD: The Moving Average Convergence Divergence (MACD) has shown positive values, suggesting bullish momentum.
- EMA: The Exponential Moving Average (EMA) has been trending slightly upwards, supporting the bullish sentiment.
Key Observation: The trend indicators point towards an upward trend in the stock price.
Momentum Analysis:
- RSI: The Relative Strength Index (RSI) has been hovering around the neutral zone, indicating a balanced momentum.
- Stochastic Oscillator: Both %K and %D have been in the overbought territory, suggesting a potential reversal.
- Williams %R: The Williams %R is also in the oversold region, signaling a possible price correction.
Key Observation: The momentum indicators suggest a potential reversal in the stock price.
Volatility Analysis:
- Bollinger Bands (BB): The Bollinger Bands have been narrowing, indicating decreasing volatility.
- BB% (Bollinger Band %B): The %B is relatively low, suggesting a potential breakout or consolidation.
- Average True Range (ATR): The ATR has been decreasing, reflecting reduced price fluctuations.
Key Observation: Volatility indicators imply a potential consolidation phase in the stock price.
Volume Analysis:
- On-Balance Volume (OBV): The OBV has been declining, indicating selling pressure in the stock.
- Chaikin Money Flow (CMF): The CMF has been negative, signaling outflows from the stock.
Key Observation: Volume indicators point towards bearish sentiment in the stock.
Conclusion:
Based on the analysis of trend, momentum, volatility, and volume indicators, the next few days' possible stock price movement for BCI is likely to be sideways to slightly bearish. The trend indicators suggest an upward bias, while momentum indicators hint at a potential reversal. Volatility indicators point towards consolidation, and volume indicators indicate bearish sentiment.
Overall Assessment: The stock may experience some price fluctuations in the near term, with a higher probability of a sideways movement. Traders should exercise caution and closely monitor key support and resistance levels for potential entry or exit points.
Disclaimer:
Remember that market conditions can change rapidly, and it's essential to conduct thorough research and consider multiple factors before making investment decisions. Consult with a financial advisor for personalized guidance tailored to your specific financial goals and risk tolerance.