Technical Analysis of BDGS 2024-05-10
Overview:
In analyzing the technical indicators for BDGS over the last 5 days, we will delve into the trend, momentum, volatility, and volume indicators to provide a comprehensive outlook on the possible stock price movement in the coming days.
Trend Analysis:
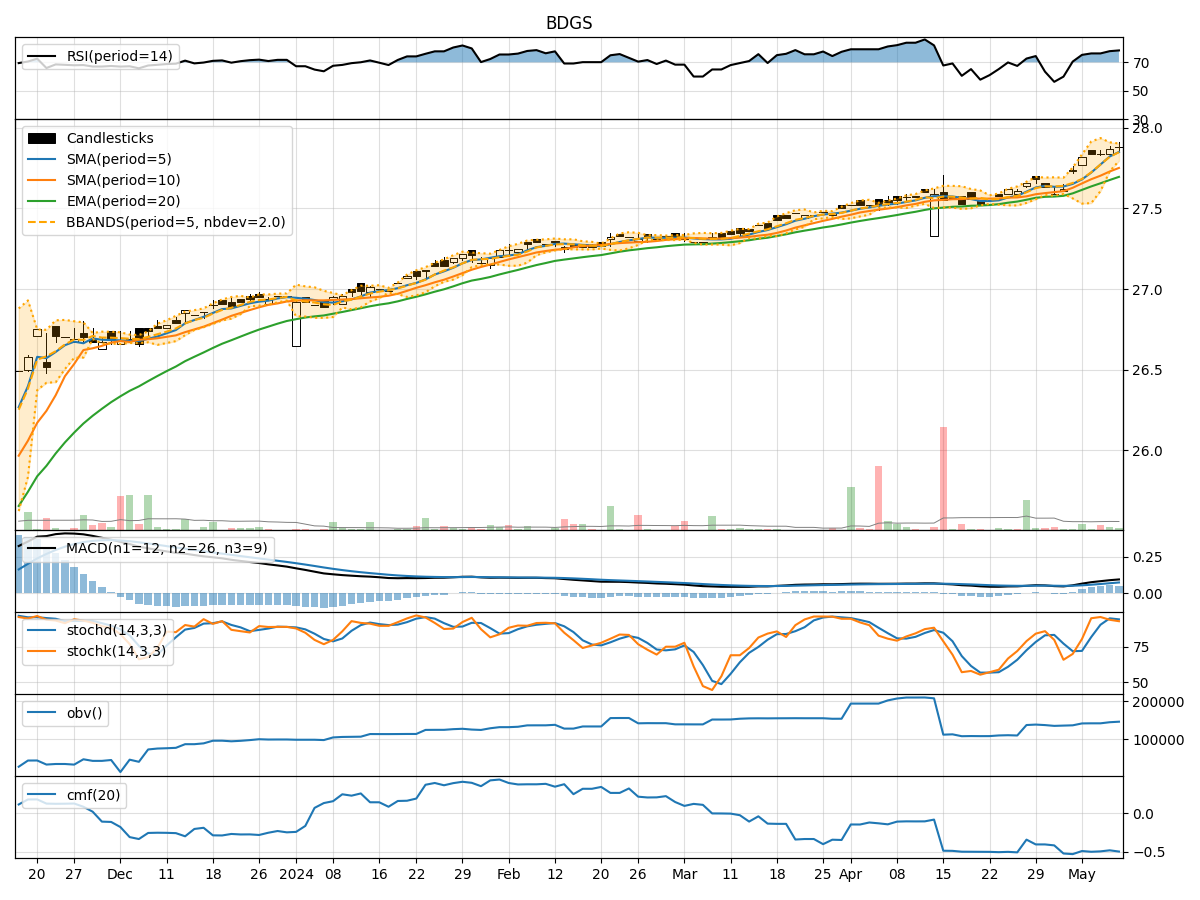
- Moving Averages (MA): The 5-day Moving Average (MA) has been consistently above the Simple Moving Average (SMA) and Exponential Moving Average (EMA), indicating a bullish trend.
- MACD: The MACD line has been consistently above the signal line, suggesting a bullish momentum in the stock price.
Momentum Analysis:
- RSI: The Relative Strength Index (RSI) has been consistently above 70, indicating overbought conditions but also strong bullish momentum.
- Stochastic Oscillator: Both %K and %D have been in the overbought zone, suggesting a potential reversal or consolidation phase.
Volatility Analysis:
- Bollinger Bands (BB): The stock price has been trading within the upper Bollinger Band, indicating an overbought condition and potential for a pullback.
Volume Analysis:
- On-Balance Volume (OBV): The OBV has been increasing, indicating accumulation by investors despite some fluctuations in volume.
- Chaikin Money Flow (CMF): The CMF has been negative, suggesting selling pressure in the stock.
Key Observations:
- The stock is currently in a strong bullish trend based on moving averages and MACD.
- Momentum indicators like RSI and Stochastic Oscillator suggest overbought conditions, signaling a potential reversal or consolidation.
- Volatility indicators point towards an overbought scenario, potentially leading to a pullback in the stock price.
- Volume indicators show mixed signals with OBV indicating accumulation but CMF reflecting selling pressure.
Conclusion:
Based on the analysis of the technical indicators, the stock price of BDGS is likely to experience a short-term pullback or consolidation in the coming days. The overbought conditions indicated by momentum and volatility indicators suggest a potential reversal in the bullish trend. Traders may consider taking profits or waiting for a better entry point before considering long positions. Exercise caution and consider risk management strategies in light of the mixed signals from volume indicators.