Technical Analysis of BECO 2024-05-10
Overview:
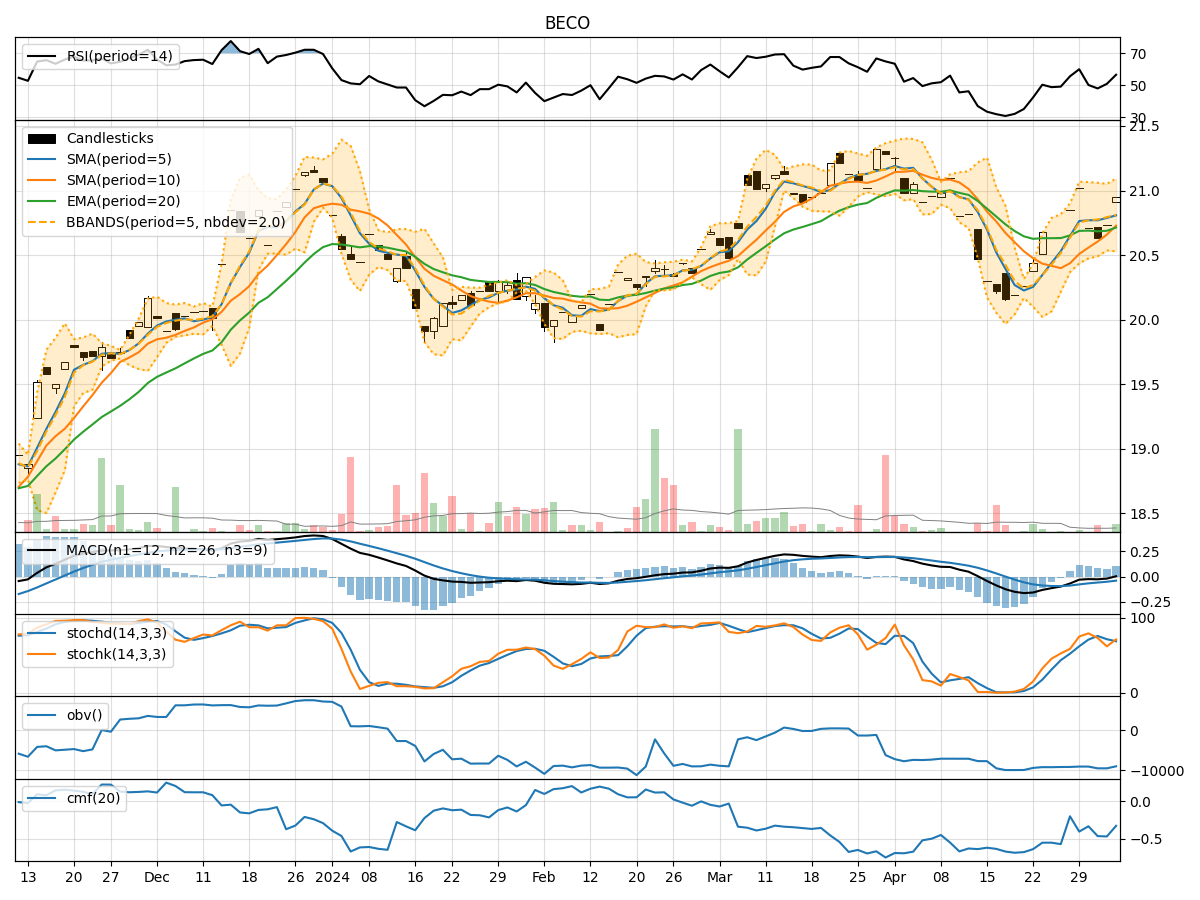
In analyzing the technical indicators for BECO stock over the last 5 days, we will delve into the trend, momentum, volatility, and volume indicators to provide a comprehensive outlook on the possible stock price movement in the coming days.
Trend Indicators:
- Moving Averages (MA): The 5-day Moving Average has been consistently above the Simple Moving Average (SMA) and Exponential Moving Average (EMA), indicating a bullish trend.
- MACD: The MACD line has been consistently above the signal line, with both lines showing an upward trend, suggesting bullish momentum.
- MACD Histogram: The MACD Histogram has been increasing over the last 5 days, indicating strengthening bullish momentum.
Momentum Indicators:
- RSI: The Relative Strength Index (RSI) has been in the overbought territory, indicating strong buying momentum.
- Stochastic Oscillator: Both %K and %D have been in the overbought zone, suggesting a strong bullish momentum.
- Williams %R: The Williams %R has been in the oversold region, indicating a potential reversal in the short term.
Volatility Indicators:
- Bollinger Bands: The stock price has been trading within the Bollinger Bands, with the bands widening slightly, indicating increased volatility.
- Bollinger %B: The %B indicator has been fluctuating around 0.8, suggesting the stock is trading near the upper band.
Volume Indicators:
- On-Balance Volume (OBV): The OBV has been showing a slight decrease, indicating some distribution happening in the stock.
- Chaikin Money Flow (CMF): The CMF has been negative, suggesting that money is flowing out of the stock.
Key Observations:
- The trend indicators suggest a strong bullish sentiment in the stock.
- Momentum indicators indicate a high buying momentum, potentially leading to further price appreciation.
- Volatility indicators show an increase in price fluctuations, which could lead to both upside and downside movements.
- Volume indicators point towards some distribution and outflow of money from the stock.
Conclusion:
Based on the analysis of the technical indicators, the stock is likely to continue its upward movement in the short term due to the strong bullish trend and momentum. However, the increased volatility and signs of distribution in volume indicators suggest that there might be some consolidation or a minor pullback before the uptrend resumes. Traders should closely monitor the price action and key support levels for potential buying opportunities.