Technical Analysis of BEDZ 2024-05-10
Overview:
In analyzing the technical indicators for BEDZ stock over the last 5 days, we will delve into the trend, momentum, volatility, and volume indicators to provide a comprehensive outlook on the possible future stock price movement. By examining these key indicators, we aim to offer valuable insights and predictions for the upcoming trading days.
Trend Analysis:
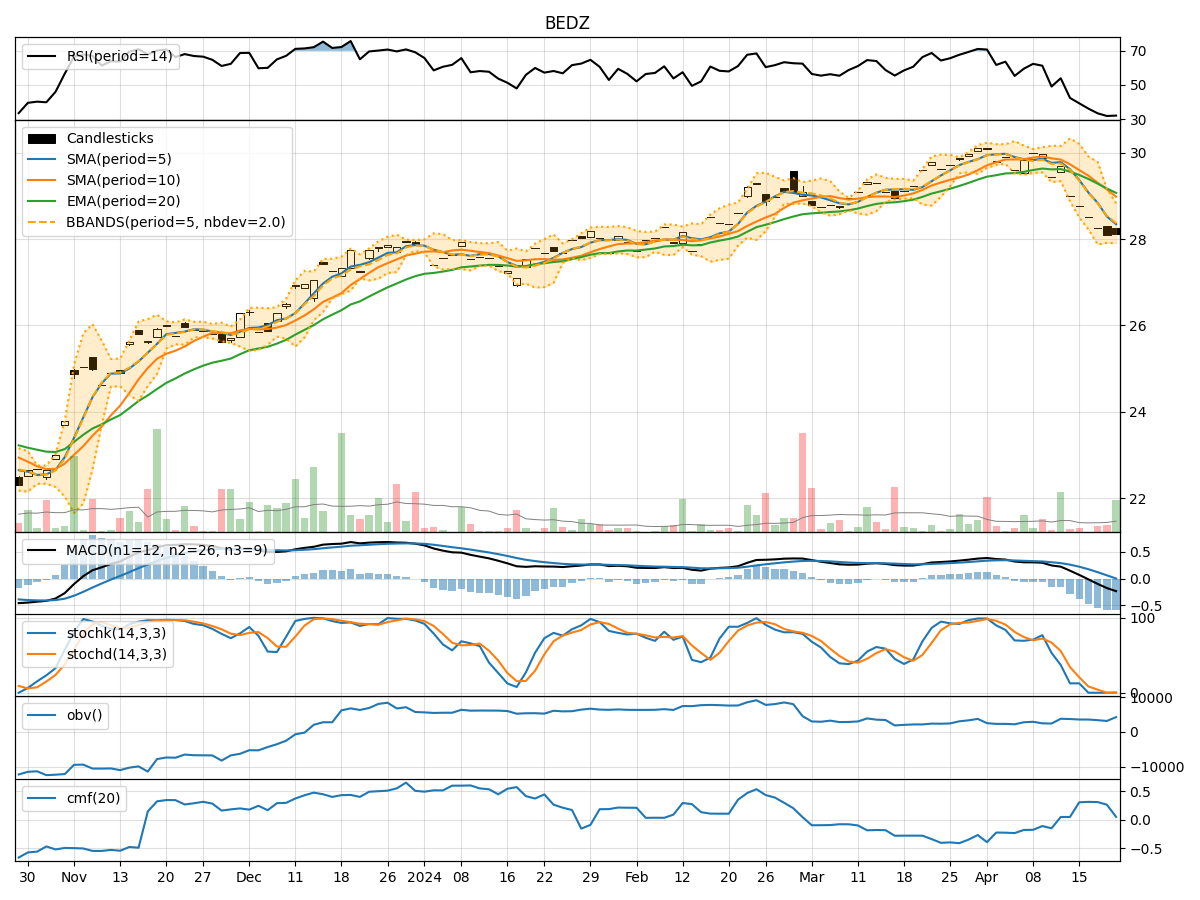
- Moving Averages (MA): The 5-day Moving Average (MA) has been fluctuating around the closing prices, indicating a lack of clear trend direction.
- MACD: The Moving Average Convergence Divergence (MACD) has been consistently negative, suggesting a bearish momentum in the short term.
- EMA: The Exponential Moving Average (EMA) has been declining, further supporting the bearish sentiment in the stock.
Momentum Analysis:
- RSI: The Relative Strength Index (RSI) has been hovering around the mid-range, indicating a neutral momentum with no clear overbought or oversold conditions.
- Stochastic Oscillator: Both %K and %D of the Stochastic Oscillator have been decreasing, signaling a weakening momentum in the stock.
- Williams %R: The Williams %R is in the oversold territory, suggesting a potential reversal or bounce in the stock price.
Volatility Analysis:
- Bollinger Bands: The Bollinger Bands have been narrowing, indicating decreasing volatility in the stock.
- Bollinger %B: The %B indicator is below 0.5, suggesting that the stock is trading below the lower Bollinger Band, potentially indicating an oversold condition.
Volume Analysis:
- On-Balance Volume (OBV): The OBV has been declining, indicating that selling pressure has been dominant in the stock.
- Chaikin Money Flow (CMF): The CMF has been negative, reflecting a bearish money flow into the stock over the past 20 days.
Conclusion:
Based on the analysis of the technical indicators, the stock is currently exhibiting bearish tendencies. The trend indicators, momentum oscillators, and volume indicators all point towards a potential downward movement in the stock price in the coming days. The narrowing Bollinger Bands and oversold Williams %R further support the likelihood of a bearish continuation.
Considering the overall technical outlook, it is advisable to exercise caution and consider potential short-selling or hedging strategies to capitalize on the expected downward movement in the stock price. Traders and investors should closely monitor key support levels and be prepared for increased volatility in the market.