Technical Analysis of BEEZ 2024-05-10
Overview:
In analyzing the technical indicators for BEEZ stock over the last 5 days, we will delve into the trend, momentum, volatility, and volume indicators to provide a comprehensive outlook on the possible stock price movement in the coming days. By examining these key indicators, we aim to offer valuable insights and predictions to guide investment decisions.
Trend Analysis:
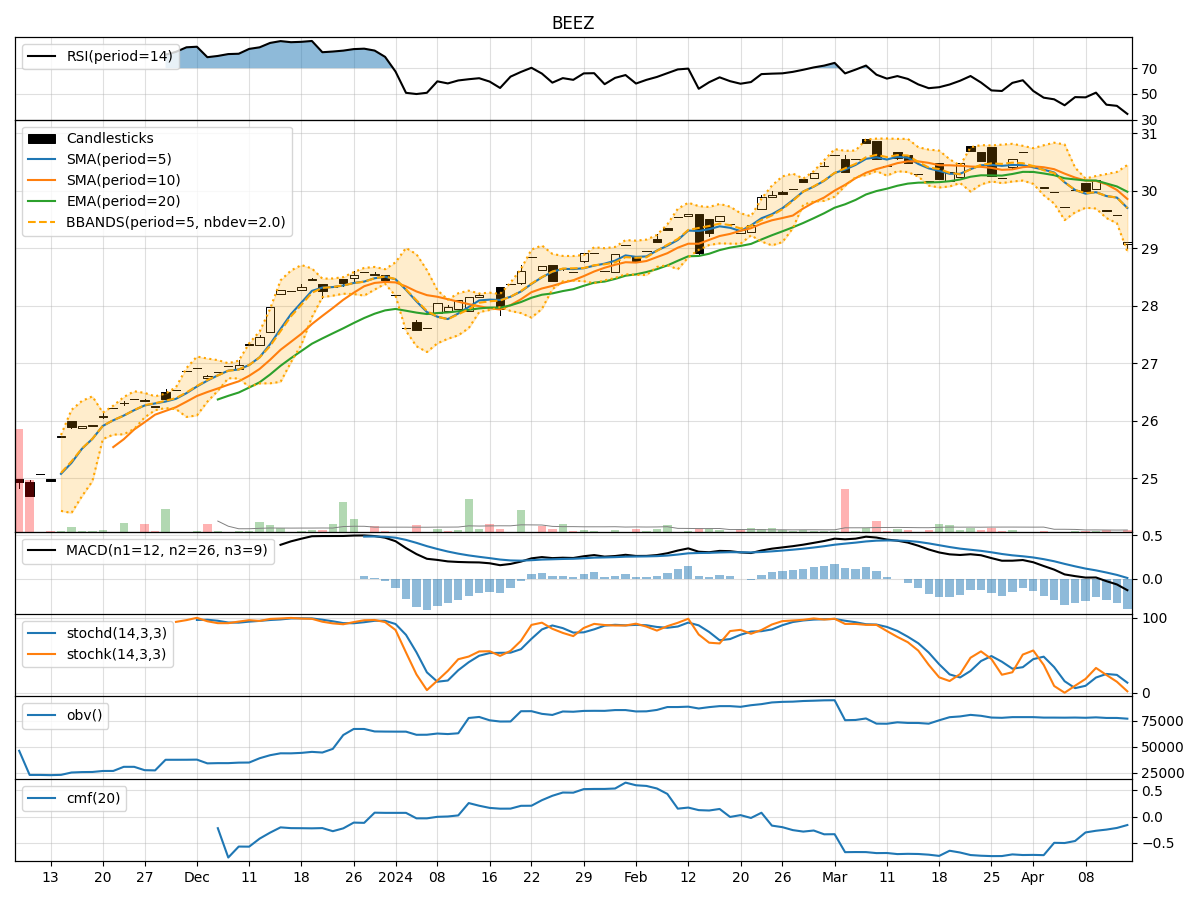
- Moving Averages (MA): The 5-day Moving Average (MA) has been consistently above the Simple Moving Average (SMA) and Exponential Moving Average (EMA), indicating a bullish trend.
- MACD: The MACD line has been gradually increasing, with the MACD histogram showing positive values, suggesting a strengthening bullish momentum.
- RSI: The Relative Strength Index (RSI) has been fluctuating around the neutral zone, indicating a balanced market sentiment.
Momentum Analysis:
- Stochastic Oscillator: Both %K and %D values have been consistently high, suggesting strong upward momentum.
- Williams %R: The Williams %R indicator has been hovering around 0, indicating a neutral momentum.
Volatility Analysis:
- Bollinger Bands (BB): The stock price has been trading within the Bollinger Bands, with the bands widening slightly, indicating increased volatility.
- Average True Range (ATR): The ATR value has been relatively stable, suggesting consistent volatility levels.
Volume Analysis:
- On-Balance Volume (OBV): The OBV has shown a slight decrease over the last few days, indicating some selling pressure.
- Chaikin Money Flow (CMF): The CMF has been negative, reflecting a bearish money flow trend.
Key Observations:
- The trend indicators suggest a bullish sentiment, supported by the MACD and moving averages.
- Momentum indicators indicate a strong upward momentum, especially highlighted by the Stochastic Oscillator.
- Volatility has slightly increased, as seen in the widening Bollinger Bands.
- The volume indicators show a slight decrease in buying pressure, as reflected in the OBV and CMF.
Conclusion:
Based on the analysis of the technical indicators, the overall outlook for BEEZ stock in the next few days is bullish. The trend is positive, momentum is strong, and volatility is slightly increasing. However, there is a slight decrease in buying pressure as indicated by the volume indicators. Therefore, investors can expect the stock price to continue its upward trajectory with potential short-term fluctuations. It is advisable to monitor the volume closely for any shifts in buying or selling pressure that could impact the stock price movement.