Technical Analysis of BEMB 2024-05-10
Overview:
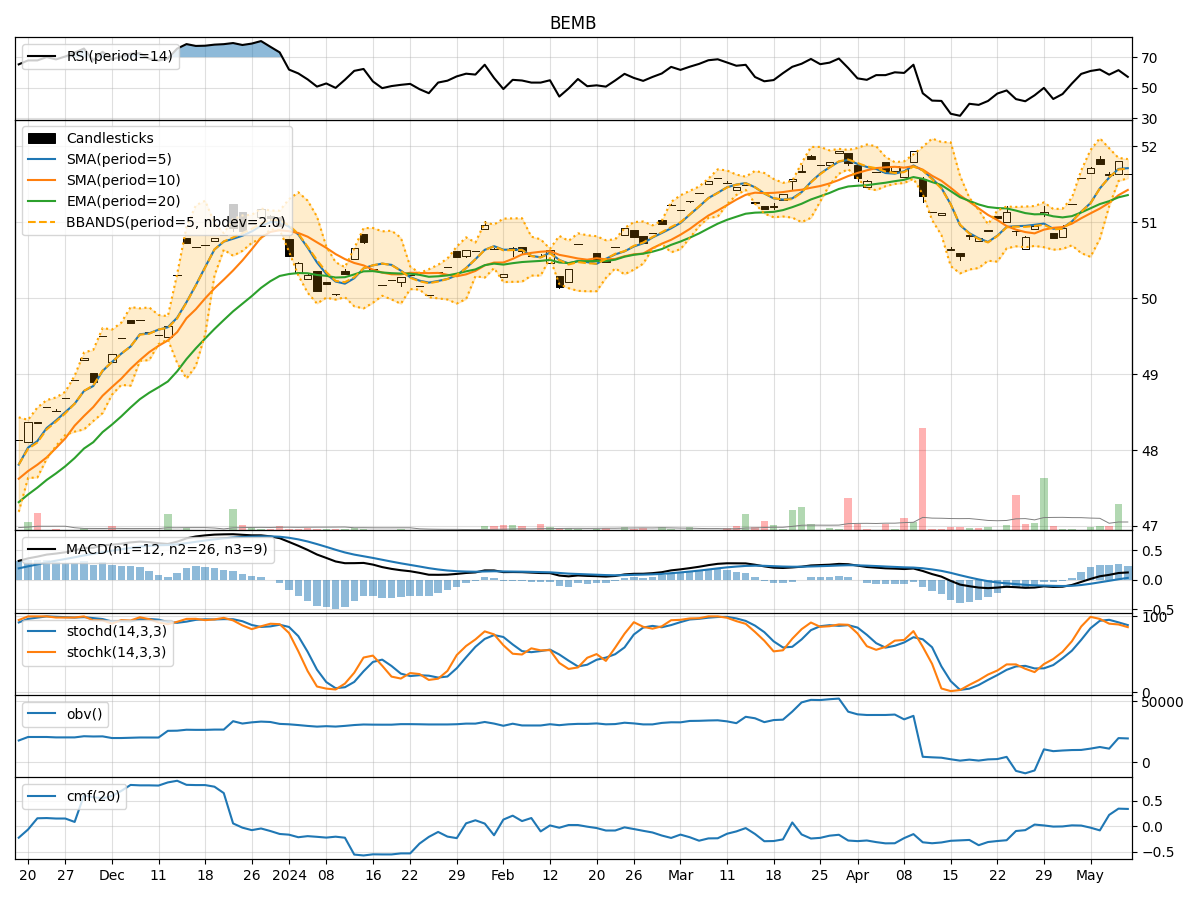
In analyzing the technical indicators for BEMB over the last 5 days, we will delve into the trends, momentum, volatility, and volume aspects to provide a comprehensive outlook on the possible stock price movement. By examining key indicators such as moving averages, MACD, RSI, Bollinger Bands, and OBV, we aim to offer valuable insights and predictions for the upcoming days.
Trend Analysis:
- Moving Averages (MA): The 5-day moving average has been consistently above the 10-day simple moving average, indicating a short-term bullish trend.
- MACD: The MACD line has been consistently above the signal line, suggesting positive momentum in the stock price.
Key Observation: The trend indicators point towards a bullish sentiment in the short term.
Momentum Analysis:
- RSI: The Relative Strength Index has been fluctuating around the 60-65 range, indicating moderate momentum.
- Stochastic Oscillator: Both %K and %D have been gradually decreasing but still remain in the overbought territory.
Key Observation: Momentum indicators suggest a neutral to slightly bearish outlook.
Volatility Analysis:
- Bollinger Bands: The stock price has been trading within the bands, with the upper and lower bands narrowing, indicating decreasing volatility.
Key Observation: Volatility indicators signal a consolidation phase.
Volume Analysis:
- On-Balance Volume (OBV): The OBV has shown mixed movements, with some days experiencing selling pressure and others showing accumulation.
Key Observation: Volume indicators reflect indecisiveness in market participation.
Conclusion:
Based on the analysis of the technical indicators, the next few days for BEMB are likely to see a sideways movement with a slight bearish bias. The trend indicators suggest a bullish sentiment, while momentum indicators lean towards a neutral to bearish outlook. Volatility indicators point towards consolidation, and volume indicators indicate market indecisiveness.
Key Conclusion: Expect the stock price to trade sideways with a slight downward bias in the upcoming days.