Technical Analysis of BETE 2024-05-10
Overview:
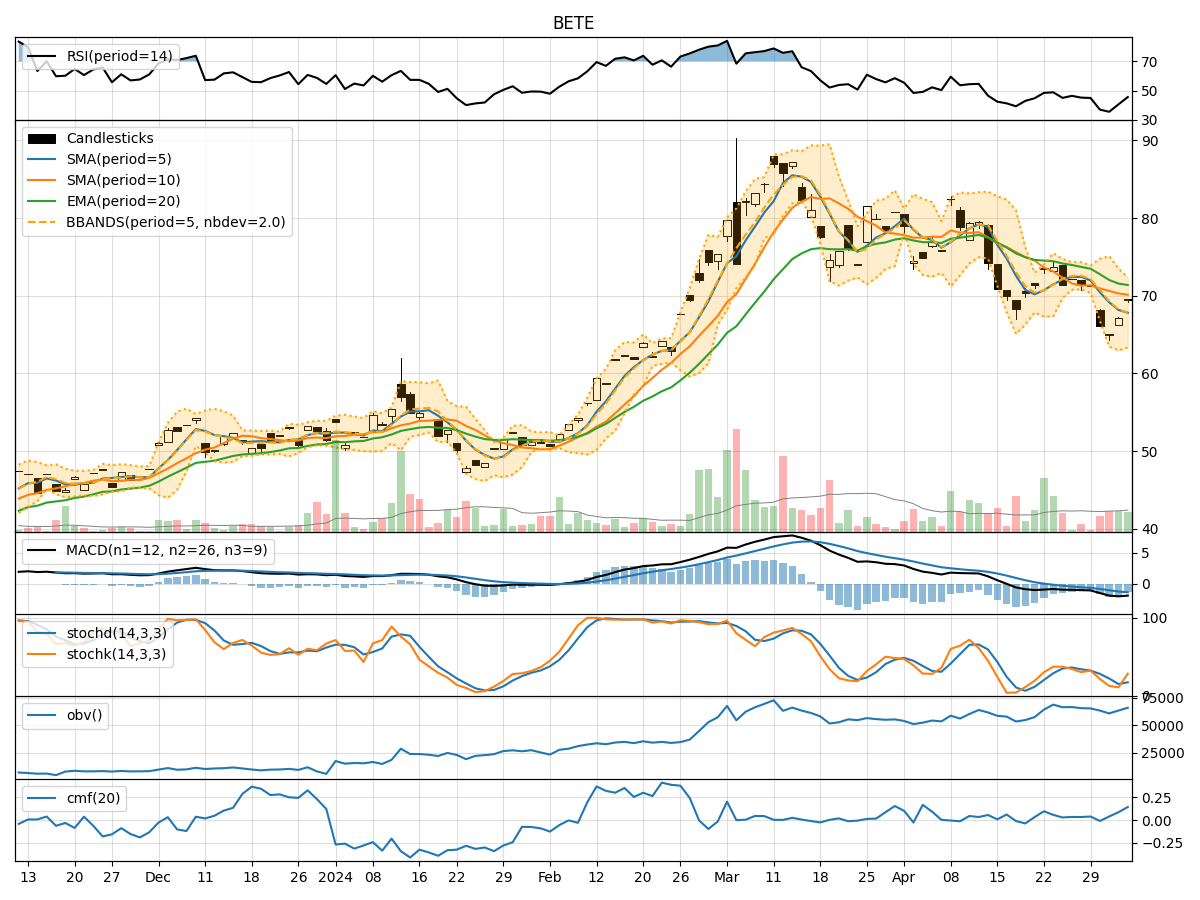
In analyzing the technical indicators for BETE stock over the last 5 days, we will delve into the trends, momentum, volatility, and volume aspects to provide a comprehensive outlook on the possible stock price movement in the coming days. By examining key indicators such as moving averages, MACD, RSI, Bollinger Bands, and OBV, we aim to offer valuable insights and predictions for informed decision-making.
Trend Analysis:
- Moving Averages (MA): The 5-day MA has been fluctuating around the closing prices, indicating short-term price trends. The stock has been trading below the 10-day SMA, suggesting a potential bearish sentiment.
- MACD: The MACD line has been consistently below the signal line, indicating a bearish trend in the stock price momentum.
- EMA: The EMA(20) has been trending downwards, reflecting a bearish sentiment in the medium to long term.
Momentum Analysis:
- RSI: The RSI has been hovering around the 40-50 range, indicating a neutral to slightly bearish momentum.
- Stochastic Oscillator: Both %K and %D have been fluctuating, but generally below 50, suggesting a bearish sentiment.
- Williams %R: The Williams %R has been consistently in the oversold territory, indicating a bearish momentum.
Volatility Analysis:
- Bollinger Bands: The stock price has been trading below the middle Bollinger Band, indicating a bearish trend. The bands are narrowing, suggesting decreased volatility.
- Bollinger %B: The %B indicator is below 1, indicating that the stock is trading below the lower Bollinger Band, signaling a potential oversold condition.
Volume Analysis:
- On-Balance Volume (OBV): The OBV has been fluctuating, but the overall trend has been slightly negative, indicating selling pressure.
- Chaikin Money Flow (CMF): The CMF has been negative, suggesting that money is flowing out of the stock.
Conclusion:
Based on the analysis of the technical indicators, the stock of BETE is currently in a bearish phase. The trends, momentum, volatility, and volume indicators all point towards a downward movement in the stock price in the coming days. Investors should exercise caution and consider potential short-selling or wait for a more favorable entry point. The stock is likely to experience further downside pressure, and a prudent strategy would be to monitor closely for any signs of reversal before considering long positions.