Technical Analysis of BETZ 2024-05-10
Overview:
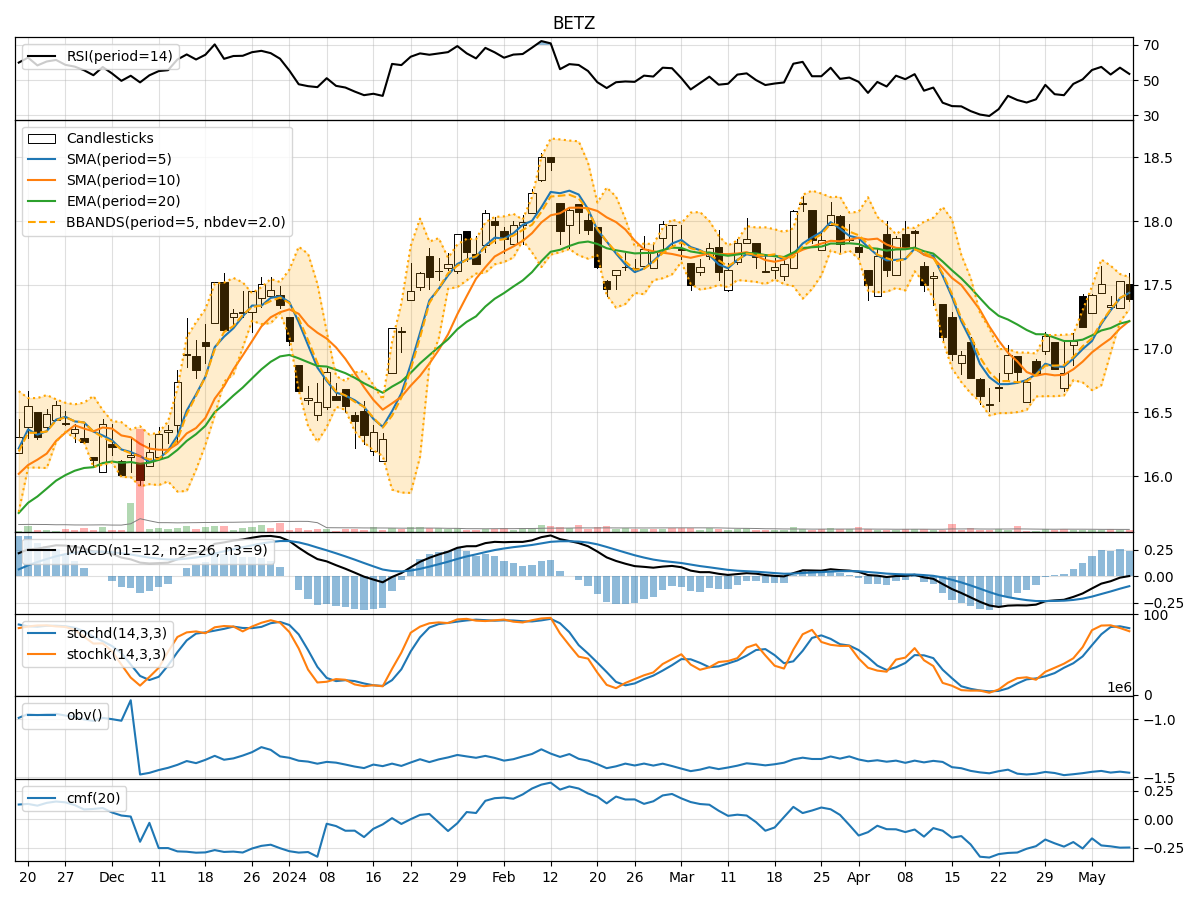
In analyzing the technical indicators for BETZ over the last 5 days, we will delve into the trend, momentum, volatility, and volume indicators to provide a comprehensive outlook on the possible stock price movement in the coming days.
Trend Analysis:
- Moving Averages (MA): The 5-day Moving Average (MA) has been consistently above the Simple Moving Average (SMA) and Exponential Moving Average (EMA), indicating a bullish trend.
- MACD: The MACD line has been consistently below the signal line, suggesting a bearish trend.
- Conclusion: The trend indicators show a mixed signal with a slight bullish bias due to the MA, but the bearish MACD indicates potential weakness.
Momentum Analysis:
- RSI: The Relative Strength Index (RSI) has been fluctuating around the 50 level, indicating a neutral momentum.
- Stochastic Oscillator: Both %K and %D have been fluctuating within the neutral zone, suggesting indecision in momentum.
- Conclusion: The momentum indicators reflect a lack of clear direction, leaning towards a sideways movement.
Volatility Analysis:
- Bollinger Bands (BB): The stock price has been trading within the Bollinger Bands, indicating normal volatility.
- Conclusion: Volatility remains stable, with no extreme movements expected in the near term.
Volume Analysis:
- On-Balance Volume (OBV): The OBV has been negative, indicating distribution of the stock.
- Chaikin Money Flow (CMF): The CMF has been consistently negative, suggesting selling pressure.
- Conclusion: Volume indicators point towards bearish sentiment and potential downward pressure on the stock price.
Key Observations and Opinions:
- Trend: The trend indicators show a slight bullish bias, but the bearish MACD signals caution.
- Momentum: The momentum indicators suggest a lack of clear direction, indicating a possible consolidation phase.
- Volatility: Volatility remains stable, with no significant price swings expected.
- Volume: The negative OBV and CMF indicate selling pressure and a bearish outlook.
Conclusion:
Based on the analysis of the technical indicators, the next few days for BETZ are likely to see sideways movement with a bearish bias. Traders should exercise caution and consider waiting for more clarity in the market before making significant trading decisions.