Technical Analysis of BFIX 2024-05-10
Overview:
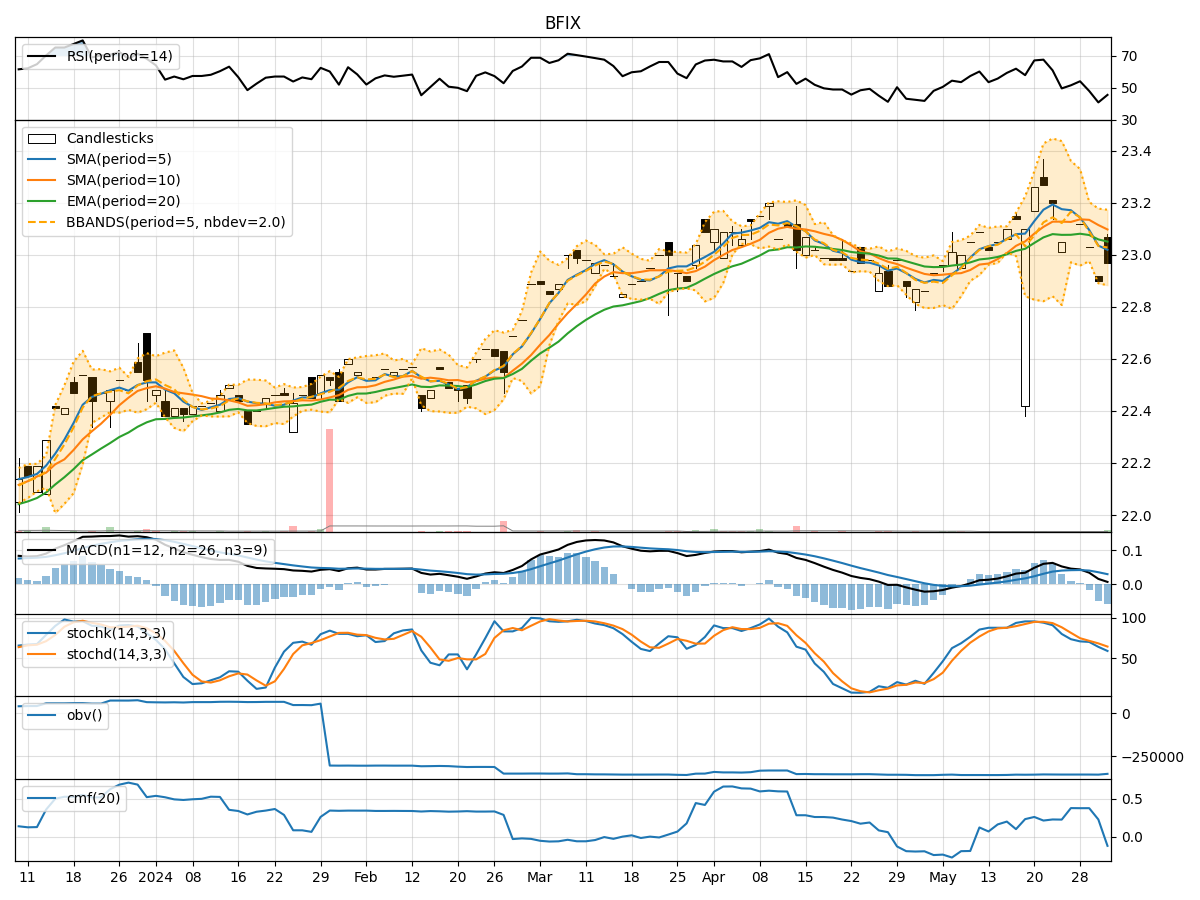
In the last 5 trading days, BFIX stock has shown mixed signals across various technical indicators. The trend indicators suggest a slight upward trend, with the moving averages showing a gradual increase in stock price. Momentum indicators indicate a strengthening momentum, with RSI and stochastic oscillators pointing towards bullish sentiment. Volatility indicators show a narrowing of the Bollinger Bands, indicating potential consolidation. Volume indicators, however, show a decrease in On-Balance Volume (OBV) and Chaikin Money Flow (CMF), suggesting a lack of strong buying pressure.
Trend Indicators:
- Moving Averages (MA): The 5-day MA has been gradually increasing, indicating a positive trend in the short term.
- MACD: The MACD line has been trending upwards, with the MACD histogram showing positive values, suggesting a bullish momentum.
- EMA: The EMA has been on an upward trajectory, supporting the bullish sentiment.
Momentum Indicators:
- RSI: The RSI has been increasing and is currently in the neutral zone, indicating potential room for further upside.
- Stochastic Oscillator: Both %K and %D lines of the stochastic oscillator are in the overbought region, suggesting a strong bullish momentum.
- Williams %R: The Williams %R is close to the oversold region, indicating a potential reversal to the upside.
Volatility Indicators:
- Bollinger Bands (BB): The Bollinger Bands have been narrowing, indicating decreasing volatility and a possible period of consolidation.
- BB %B: The %B indicator is hovering around the middle, suggesting a balanced market sentiment.
Volume Indicators:
- On-Balance Volume (OBV): The OBV has been decreasing, indicating a lack of strong buying interest in the stock.
- Chaikin Money Flow (CMF): The CMF has also been declining, reflecting a decrease in buying pressure.
Conclusion:
Based on the analysis of the technical indicators, the next few days for BFIX stock are likely to see further upward movement. The trend indicators, momentum indicators, and volatility indicators all point towards a continuation of the bullish trend. However, the decreasing volume indicators raise some concerns about the sustainability of this upward movement. Traders should closely monitor the volume levels to confirm the strength of the current trend. Overall, the technical outlook suggests a bullish bias for the next few days, with potential for a continuation of the current uptrend.