Technical Analysis of BFOR 2024-05-10
Overview:
In analyzing the technical indicators for BFOR over the last 5 days, we will delve into the trend, momentum, volatility, and volume indicators to provide a comprehensive outlook on the possible stock price movement in the coming days. By examining these key aspects, we aim to offer valuable insights and predictions to guide your investment decisions.
Trend Analysis:
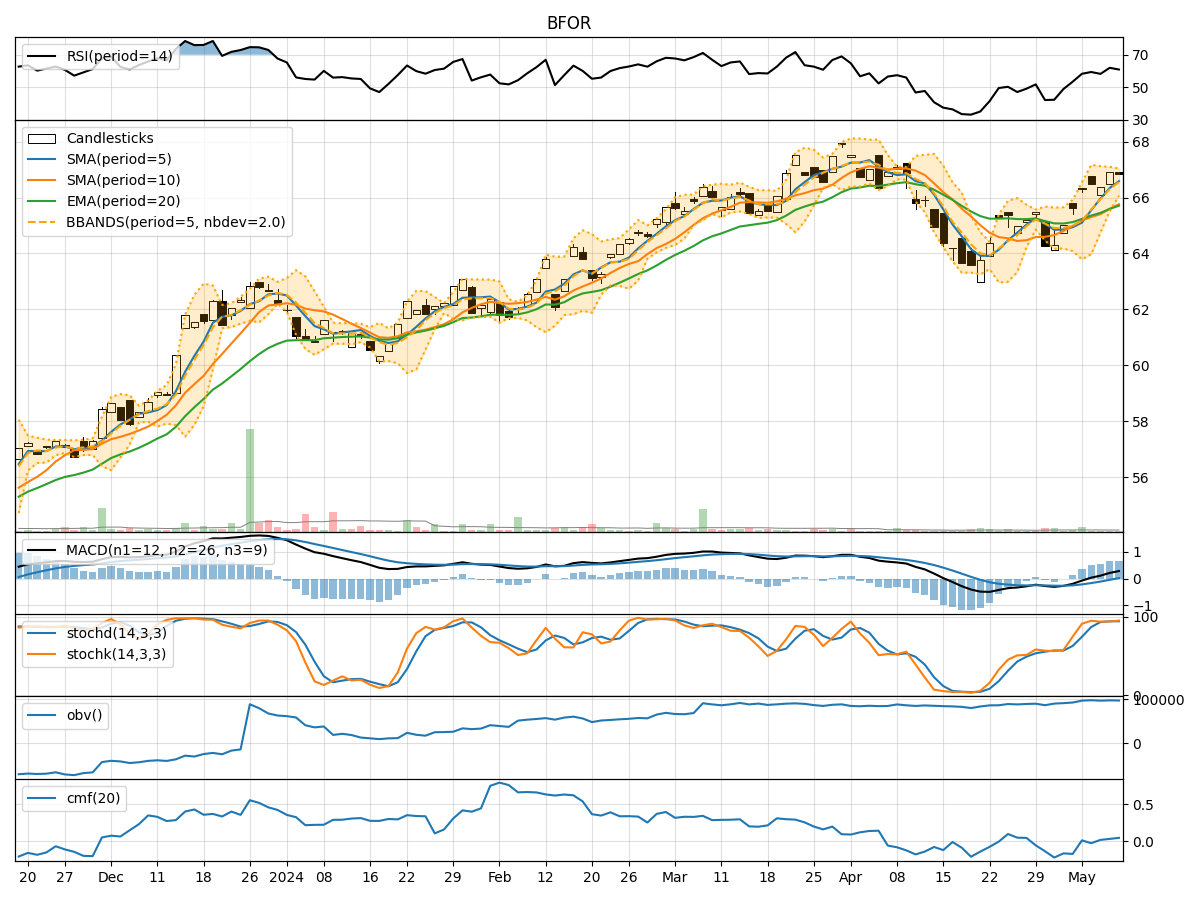
- Moving Averages (MA): The 5-day Moving Average (MA) has been consistently above the Simple Moving Average (SMA) and Exponential Moving Average (EMA), indicating a bullish trend.
- MACD: The MACD line has been consistently above the signal line, with the MACD histogram showing an increasing positive trend, suggesting bullish momentum.
Momentum Analysis:
- RSI: The Relative Strength Index (RSI) has been fluctuating within the neutral range, indicating a balanced momentum.
- Stochastic Oscillator: Both %K and %D lines of the Stochastic Oscillator have been in the overbought zone, suggesting a potential reversal or consolidation.
Volatility Analysis:
- Bollinger Bands (BB): The stock price has been trading within the Bollinger Bands, with the bands narrowing, indicating decreasing volatility.
- Bollinger %B: The %B indicator has been hovering around 0.7, suggesting a moderate level of volatility.
Volume Analysis:
- On-Balance Volume (OBV): The OBV has shown slight fluctuations but overall has been relatively stable, indicating consistent buying interest.
- Chaikin Money Flow (CMF): The CMF has been positive, reflecting a healthy inflow of money into the stock.
Key Observations and Opinions:
- Trend: The trend indicators suggest a strong bullish sentiment in the short term.
- Momentum: The momentum indicators show a mixed signal, with RSI indicating neutrality and Stochastic Oscillator hinting at a potential reversal.
- Volatility: Volatility has been decreasing, indicating a possible period of consolidation.
- Volume: The volume indicators point towards steady buying interest in the stock.
Conclusion:
Based on the analysis of the technical indicators, the next few days' possible stock price movement for BFOR is likely to be sideways with a slight bullish bias. While the trend remains bullish, the mixed signals from momentum indicators and decreasing volatility suggest a period of consolidation. Investors may expect the stock price to trade within a narrow range with a potential upward bias. It is advisable to closely monitor the Stochastic Oscillator for any signs of a reversal and the Bollinger Bands for potential breakout opportunities.