Technical Analysis of BGLD 2024-05-10
Overview:
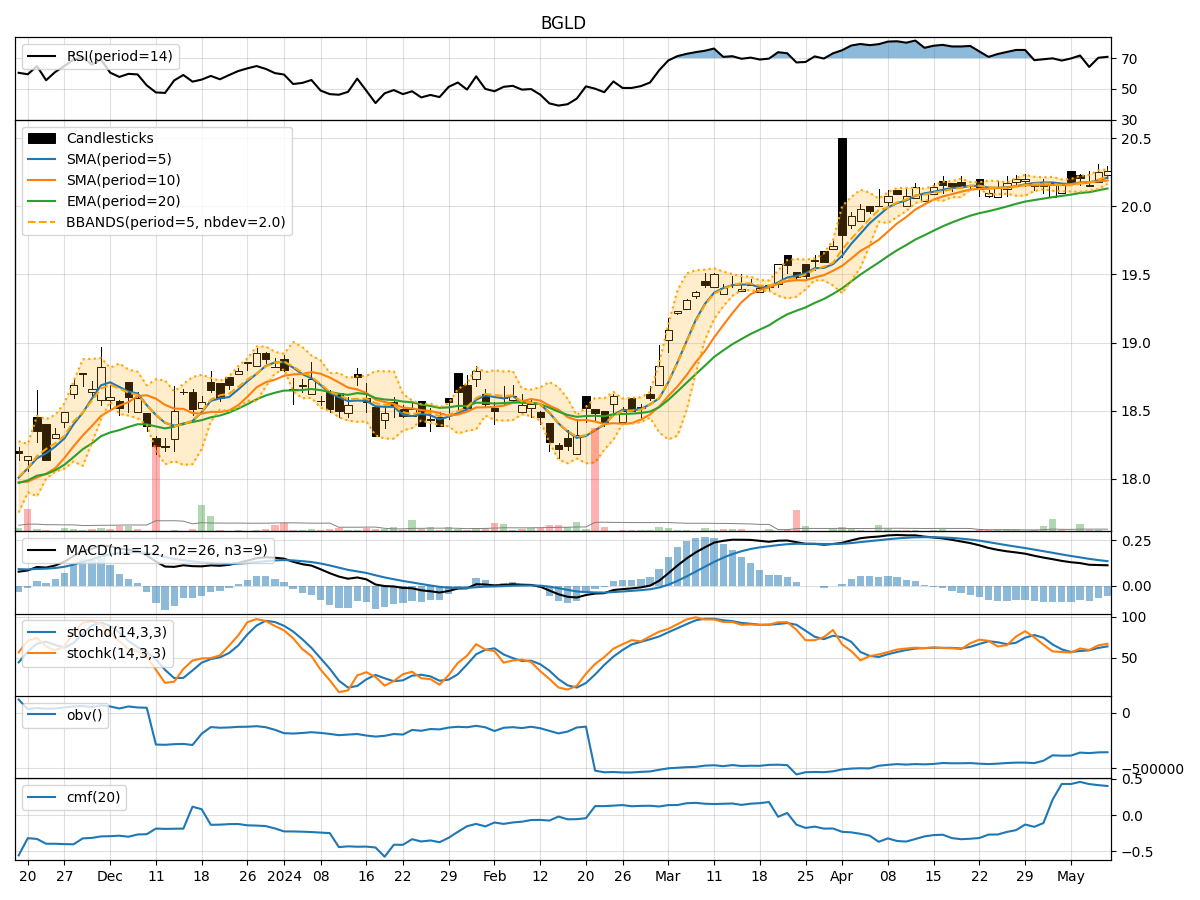
In analyzing the technical indicators for BGLD over the last 5 days, we will delve into the trend, momentum, volatility, and volume indicators to provide a comprehensive outlook on the possible stock price movement in the coming days. By examining these key indicators, we aim to offer valuable insights and predictions for informed decision-making.
Trend Analysis:
- Moving Averages (MA): The 5-day Moving Average (MA) has been consistently above the Simple Moving Average (SMA) and Exponential Moving Average (EMA), indicating a short-term bullish trend.
- MACD: The MACD line has been positive and above the signal line, suggesting bullish momentum in the stock price.
- RSI: The Relative Strength Index (RSI) has been in the overbought territory, indicating a strong bullish sentiment in the market.
Momentum Analysis:
- Stochastic Oscillator: Both %K and %D lines of the Stochastic Oscillator have been in the overbought zone, signaling a potential reversal or consolidation.
- Williams %R: The Williams %R indicator has been consistently in the oversold region, suggesting a possible reversal in the stock price.
Volatility Analysis:
- Bollinger Bands (BB): The stock price has been trading within the upper Bollinger Band (BBU), indicating an overbought condition. However, the bands have not shown significant expansion, suggesting a potential consolidation phase.
- Volatility Percentage (BBP): The Bollinger Bands Percentage has been fluctuating, indicating moderate volatility in the stock price.
Volume Analysis:
- On-Balance Volume (OBV): The OBV has shown a slight decrease over the last 5 days, indicating some distribution happening in the stock.
- Chaikin Money Flow (CMF): The CMF has been positive but showing a slight decline, suggesting a weakening buying pressure.
Conclusion:
Based on the analysis of the technical indicators, the stock of BGLD is currently in an overbought state with strong bullish momentum. However, the overbought conditions in the Stochastic Oscillator and Williams %R, along with the potential consolidation indicated by the Bollinger Bands, suggest a possible short-term correction or sideways movement in the stock price. Traders should exercise caution and consider taking profits or implementing risk management strategies in anticipation of a potential pullback.