Technical Analysis of BHYB 2024-05-10
Overview:
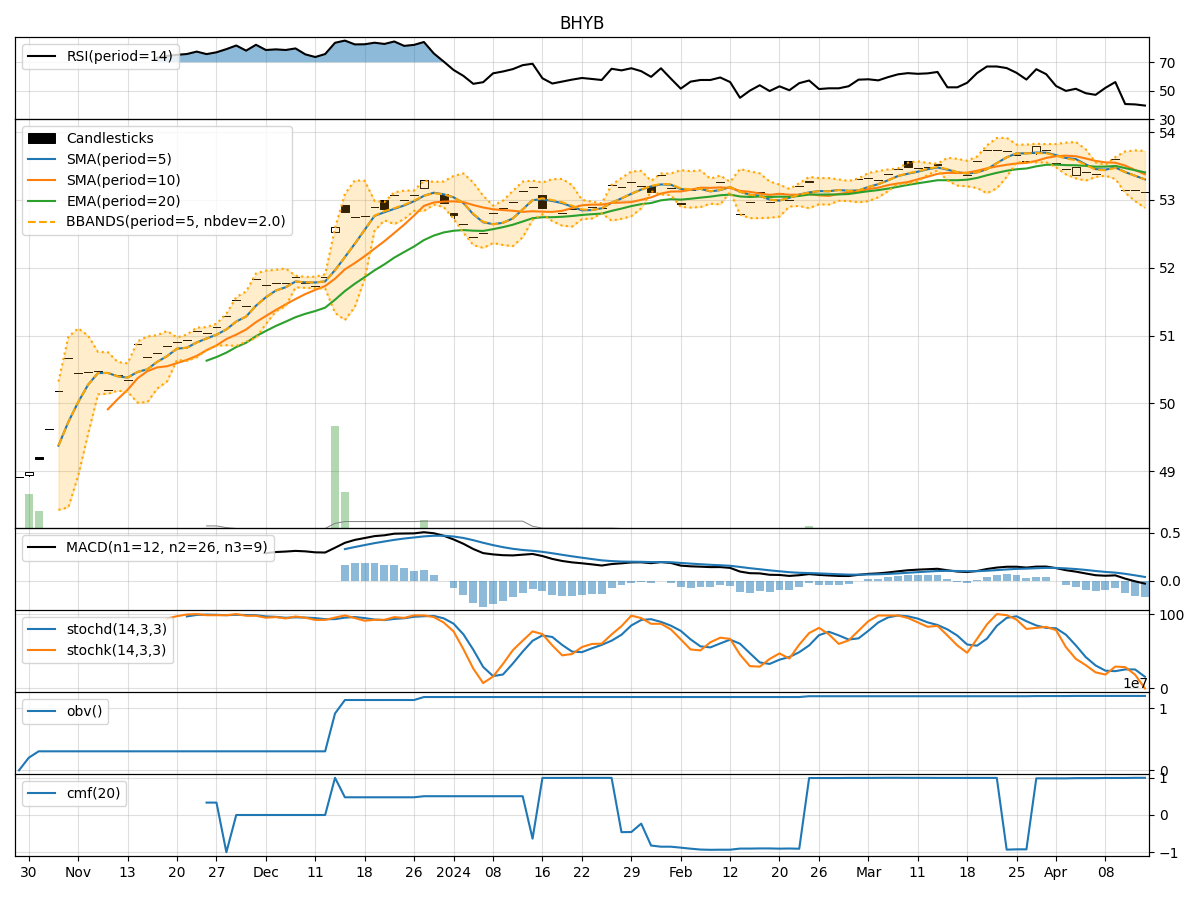
In analyzing the technical indicators for BHYB over the last 5 days, we will delve into the trend, momentum, volatility, and volume indicators to gain a comprehensive understanding of the stock's potential price movement. By examining key metrics such as moving averages, MACD, RSI, Bollinger Bands, and OBV, we aim to provide valuable insights and predictions for the next few days.
Trend Indicators:
- Moving Averages (MA): The 5-day MA has been consistently above the closing prices, indicating a short-term uptrend.
- MACD: The MACD line has been above the signal line, suggesting bullish momentum.
- EMA: The EMA(20) has been trending upwards, supporting the bullish sentiment.
Key Observation: The trend indicators point towards an upward movement in the stock price.
Momentum Indicators:
- RSI: The RSI has been fluctuating around the 50 level, indicating neutral momentum.
- Stochastic Oscillator: Both %K and %D have been declining, signaling a potential reversal.
- Williams %R: The indicator has been in oversold territory, suggesting a possible bounce back.
Key Observation: Momentum indicators are currently mixed, with a slight bearish bias.
Volatility Indicators:
- Bollinger Bands: The stock price has been trading within the bands, indicating normal volatility.
- Bollinger %B: The %B is hovering around the midline, reflecting equilibrium.
Key Observation: Volatility indicators suggest a sideways movement in the stock price.
Volume Indicators:
- On-Balance Volume (OBV): The OBV has been relatively flat, indicating no significant accumulation or distribution.
- Chaikin Money Flow (CMF): The CMF(20) is at zero, suggesting a lack of buying or selling pressure.
Key Observation: Volume indicators reflect a lack of conviction in the market.
Conclusion:
Based on the analysis of trend, momentum, volatility, and volume indicators, the next few days for BHYB are likely to see a sideways movement with a slight bearish bias in momentum. While the trend indicators suggest an upward bias, the mixed momentum signals and lack of volume conviction indicate a potential consolidation phase. Traders should exercise caution and wait for clearer signals before taking significant positions.