Technical Analysis of BIBL 2024-05-10
Overview:
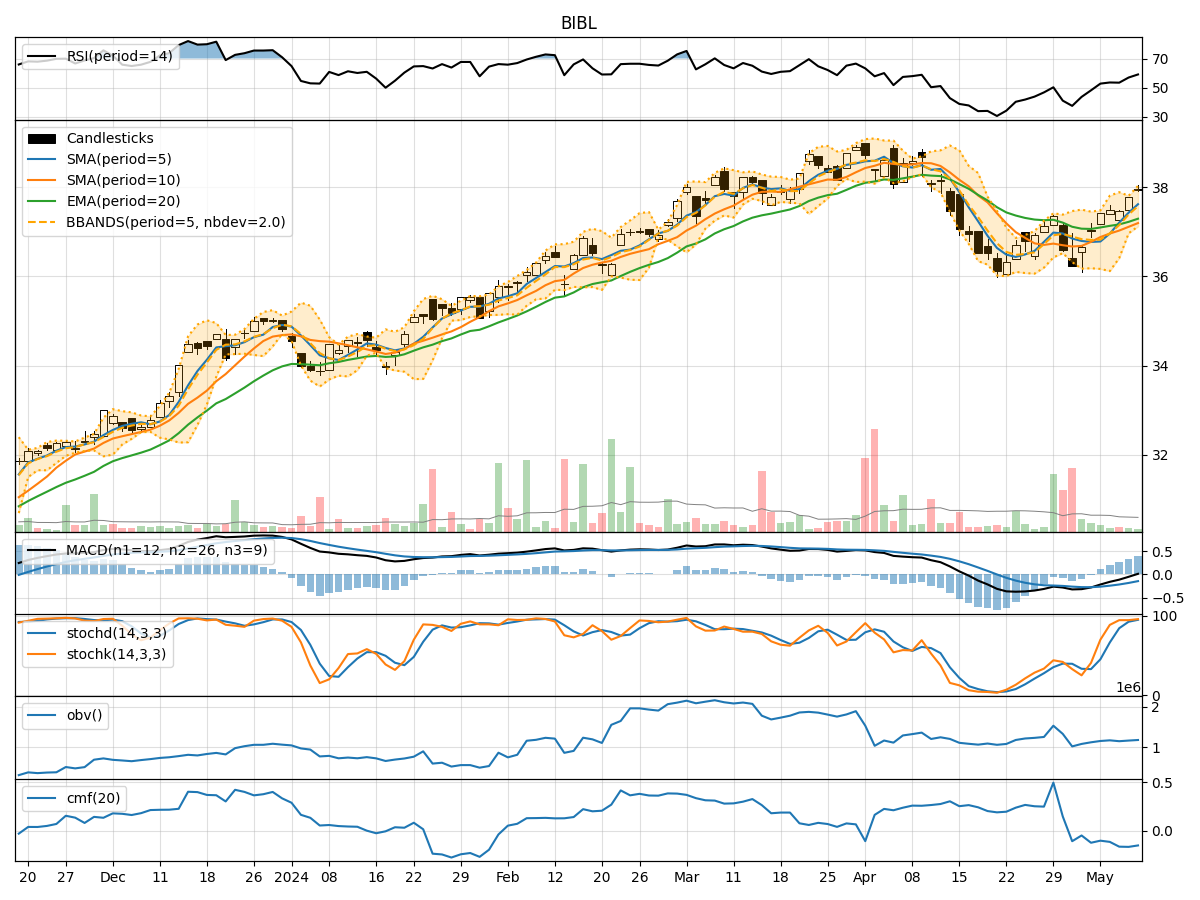
In analyzing the technical indicators for BIBL over the last 5 days, we will delve into the trends, momentum, volatility, and volume indicators to provide a comprehensive outlook on the possible stock price movement in the coming days. By examining key metrics such as moving averages, MACD, RSI, Bollinger Bands, and OBV, we aim to offer valuable insights and predictions for potential price action.
Trend Indicators:
- Moving Averages (MA): The 5-day MA has been consistently above the closing prices, indicating a short-term uptrend.
- MACD: The MACD line has been positive, with the MACD histogram showing an increasing trend, suggesting bullish momentum.
- EMA: The EMA has been trending upwards, reflecting a positive sentiment in the stock.
Momentum Indicators:
- RSI: The RSI has been fluctuating around the 50 level, indicating a neutral stance in momentum.
- Stochastic Oscillator: Both %K and %D have been in overbought territory, signaling a potential reversal.
- Williams %R: The indicator has been hovering near oversold levels, suggesting a possible buying opportunity.
Volatility Indicators:
- Bollinger Bands (BB): The stock price has been trading within the bands, indicating a period of consolidation.
- BB Width: The bands have been narrowing, suggesting a decrease in volatility.
- BB %B: The %B indicator has been fluctuating around the middle band, reflecting a balanced market sentiment.
Volume Indicators:
- On-Balance Volume (OBV): The OBV has shown mixed signals, with some days seeing accumulation and others distribution.
- Chaikin Money Flow (CMF): The CMF has been negative, indicating selling pressure in the stock.
Conclusion:
Based on the analysis of the technical indicators, the stock is currently in a consolidation phase with neutral momentum and low volatility. The moving averages and MACD suggest a slight bullish bias, while the stochastic oscillator and Williams %R point to a potential reversal in the short term. The OBV and CMF indicate a mixed sentiment among investors.
Therefore, the next few days may see the stock price consolidating within a range, with a slight upward bias if the bullish momentum continues. Traders should watch for a breakout above the recent highs for a potential bullish move, while being cautious of a reversal if key support levels are breached.