Technical Analysis of BINV 2024-05-10
Overview:
In analyzing the technical indicators for BINV over the last 5 days, we will delve into the trend, momentum, volatility, and volume indicators to provide a comprehensive outlook on the possible stock price movement in the coming days. By examining these key aspects, we aim to offer valuable insights and predictions for potential investors.
Trend Analysis:
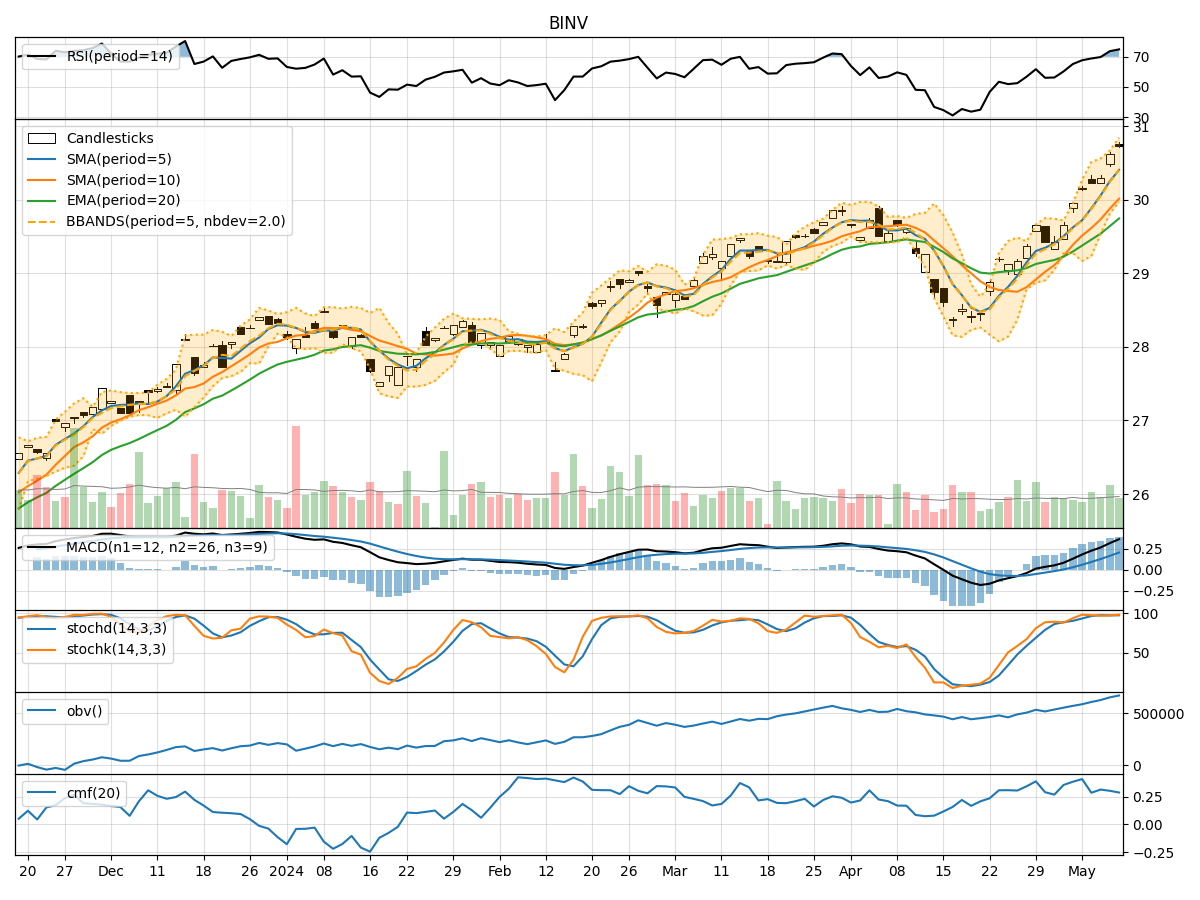
- Moving Averages (MA): The 5-day Moving Average (MA) has been consistently above the Simple Moving Average (SMA) and Exponential Moving Average (EMA), indicating a bullish trend.
- MACD: The MACD line has been consistently above the signal line, with both lines showing an upward trend, suggesting bullish momentum.
Momentum Analysis:
- RSI: The Relative Strength Index (RSI) has been trending upwards and is currently in the overbought territory, indicating a strong bullish momentum.
- Stochastic Oscillator: Both %K and %D lines of the Stochastic Oscillator are in the overbought zone, suggesting a potential reversal or consolidation.
Volatility Analysis:
- Bollinger Bands (BB): The stock price has been trading within the upper Bollinger Band (BBU), indicating an increased volatility and a potential overbought condition.
Volume Analysis:
- On-Balance Volume (OBV): The OBV has been steadily increasing over the last 5 days, indicating strong buying pressure.
- Chaikin Money Flow (CMF): The CMF has been positive, suggesting that money is flowing into the stock.
Key Observations:
- The trend indicators suggest a strong bullish sentiment in the stock.
- Momentum indicators indicate a potential overbought condition, signaling a need for caution.
- Volatility is increasing, which could lead to sharp price movements.
- Volume indicators show strong buying pressure, supporting the bullish outlook.
Conclusion:
Based on the analysis of the technical indicators, the stock is currently in a strong bullish trend. However, the momentum indicators suggest a potential overbought condition, which could lead to a short-term pullback or consolidation. Traders should be cautious of a possible reversal in the near future. Considering the increased volatility and strong buying pressure, the stock may experience further upside potential in the coming days, but investors should closely monitor the price action for any signs of a trend reversal.
In conclusion, the overall outlook for BINV is bullish, but traders should exercise caution and consider implementing risk management strategies to navigate potential market fluctuations.