Technical Analysis of BITC 2024-05-10
Overview:
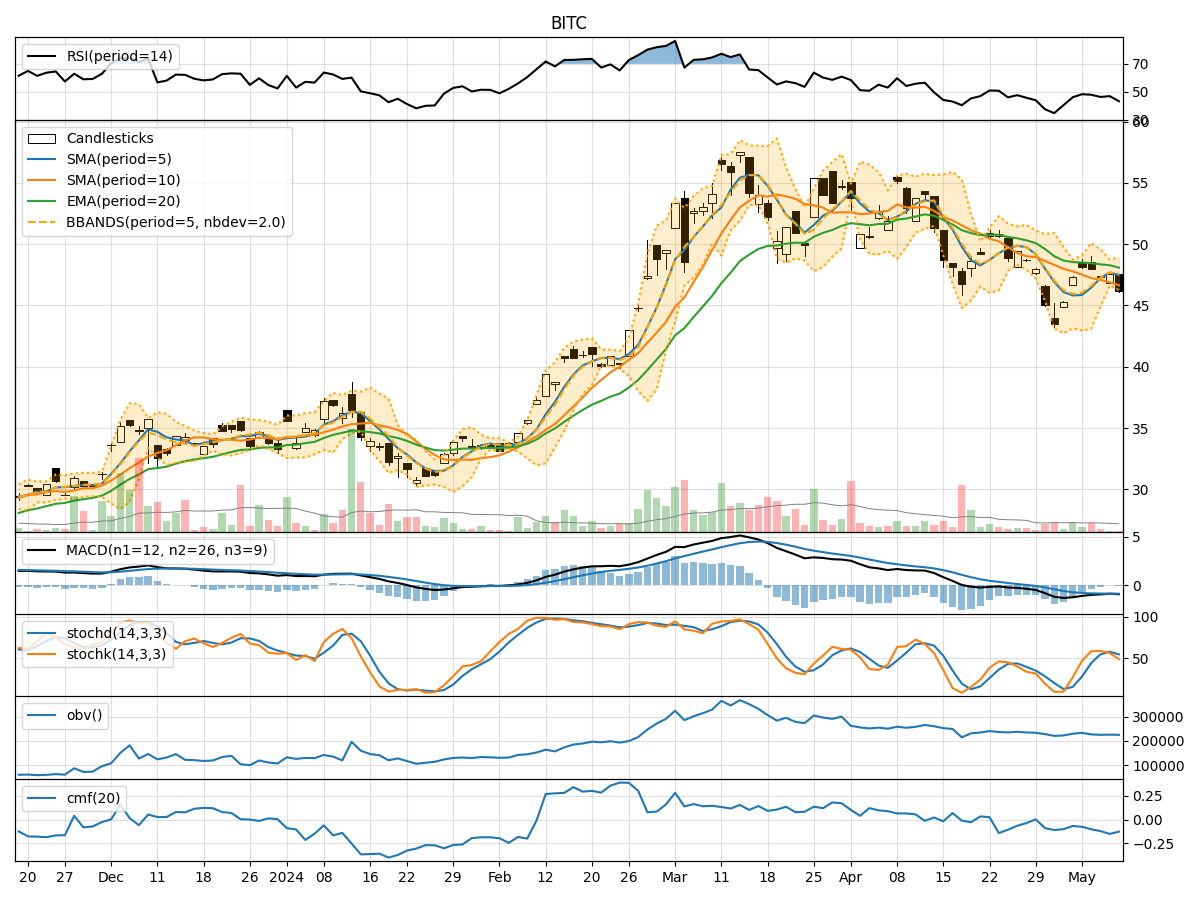
In the last 5 trading days, BITC stock has shown a mixed performance based on various technical indicators. The trend indicators suggest a slight bearish sentiment, with the Moving Average Convergence Divergence (MACD) showing negative values. Momentum indicators also indicate a weakening trend, with the Relative Strength Index (RSI) trending downwards. Volatility indicators show fluctuating Bollinger Bands, while volume indicators suggest a slight decrease in On-Balance Volume (OBV) and Chaikin Money Flow (CMF).
Trend Indicators:
- Moving Averages (MA) show a downward trend, with the 5-day MA below the 10-day Simple Moving Average (SMA).
- Exponential Moving Average (EMA) is also trending downwards, indicating a bearish sentiment.
- MACD and its signal line are negative, with the MACD Histogram showing a decreasing trend.
Momentum Indicators:
- RSI has been declining over the past 5 days, indicating weakening momentum.
- Stochastic Oscillator shows a mixed picture, with %K above %D but both trending downwards.
- Williams %R is in the oversold territory, suggesting a possible reversal.
Volatility Indicators:
- Bollinger Bands are fluctuating, indicating potential price volatility.
- Bollinger Band Percentage (BBP) is low, suggesting a possible consolidation phase.
Volume Indicators:
- On-Balance Volume (OBV) has been decreasing, indicating selling pressure.
- Chaikin Money Flow (CMF) is negative, reflecting a bearish sentiment.
Key Observations:
- Trend: The overall trend is bearish based on moving averages and MACD.
- Momentum: Momentum is weakening as RSI declines and Williams %R is oversold.
- Volatility: Bollinger Bands suggest potential price volatility ahead.
- Volume: Decreasing OBV and negative CMF indicate selling pressure.
Conclusion:
Based on the analysis of technical indicators, the next few days for BITC stock are likely to see further downward movement. The bearish trend indicated by moving averages and MACD, coupled with weakening momentum and negative volume indicators, suggest a continuation of the current downtrend. Traders and investors should exercise caution and consider short-term selling or staying on the sidelines until a clearer bullish signal emerges.