Technical Analysis of BJAN 2024-05-10
Overview:
In analyzing the technical indicators for BJAN stock over the last 5 days, we will delve into the trends, momentum, volatility, and volume indicators to provide a comprehensive outlook on the possible stock price movement in the coming days. By examining these key indicators, we aim to offer valuable insights and predictions for potential investors.
Trend Indicators:
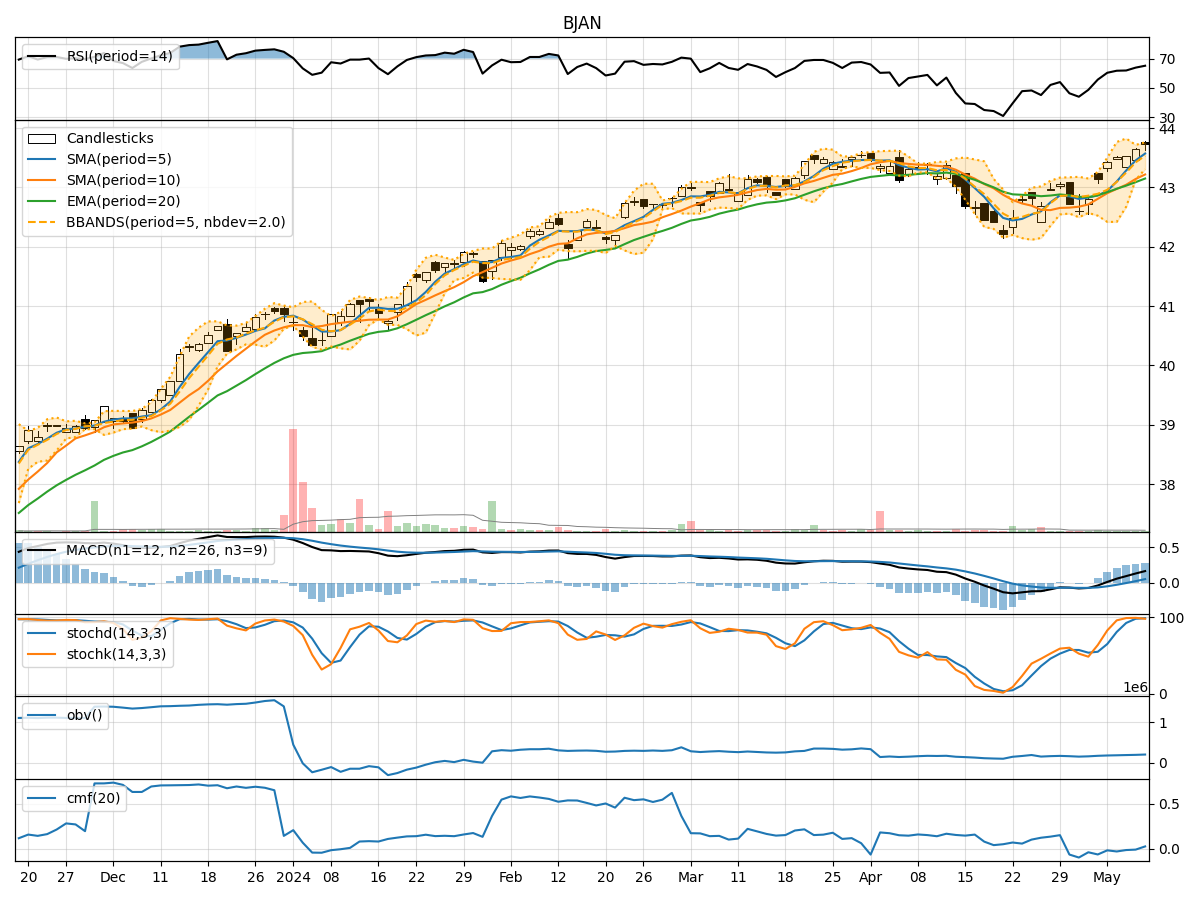
- Moving Averages (MA): The 5-day moving average has been consistently above the simple moving average (SMA) of 10 days, indicating a short-term bullish trend.
- Exponential Moving Average (EMA): The EMA has been showing an upward trend, suggesting positive momentum in the stock price.
- Moving Average Convergence Divergence (MACD): The MACD and signal line have been in positive territory, indicating a bullish trend.
Momentum Indicators:
- Relative Strength Index (RSI): The RSI has been trending upwards, indicating increasing buying pressure and potential overbought conditions.
- Stochastic Oscillator: Both %K and %D have been in the overbought zone, suggesting a potential reversal or consolidation.
- Williams %R (Willams %R): The Williams %R has been in the oversold territory, indicating a potential buying opportunity.
Volatility Indicators:
- Bollinger Bands (BB): The stock price has been trading within the upper Bollinger Band, suggesting a period of high volatility and a potential overbought condition.
Volume Indicators:
- On-Balance Volume (OBV): The OBV has been declining, indicating a divergence between price and volume, which could signal a potential trend reversal.
- Chaikin Money Flow (CMF): The CMF has been negative, indicating selling pressure in the stock.
Key Observations and Opinions:
- Trend: The stock is currently in an upward trend based on moving averages and MACD.
- Momentum: The momentum indicators suggest a mixed signal with overbought and oversold conditions.
- Volatility: The Bollinger Bands indicate high volatility, potentially leading to a correction.
- Volume: The declining OBV and negative CMF signal weakness in the stock's price movement.
Conclusion:
Based on the analysis of the technical indicators, the next few days' possible stock price movement for BJAN is likely to experience consolidation or a minor correction. The stock may enter a period of sideways trading as the overbought and oversold conditions normalize. Investors should exercise caution and consider waiting for clearer signals before making significant trading decisions.