Technical Analysis of BJUN 2024-05-10
Overview:
In analyzing the technical indicators for BJUN over the last 5 days, we will delve into the trend, momentum, volatility, and volume indicators to provide a comprehensive outlook on the possible stock price movement in the coming days.
Trend Analysis:
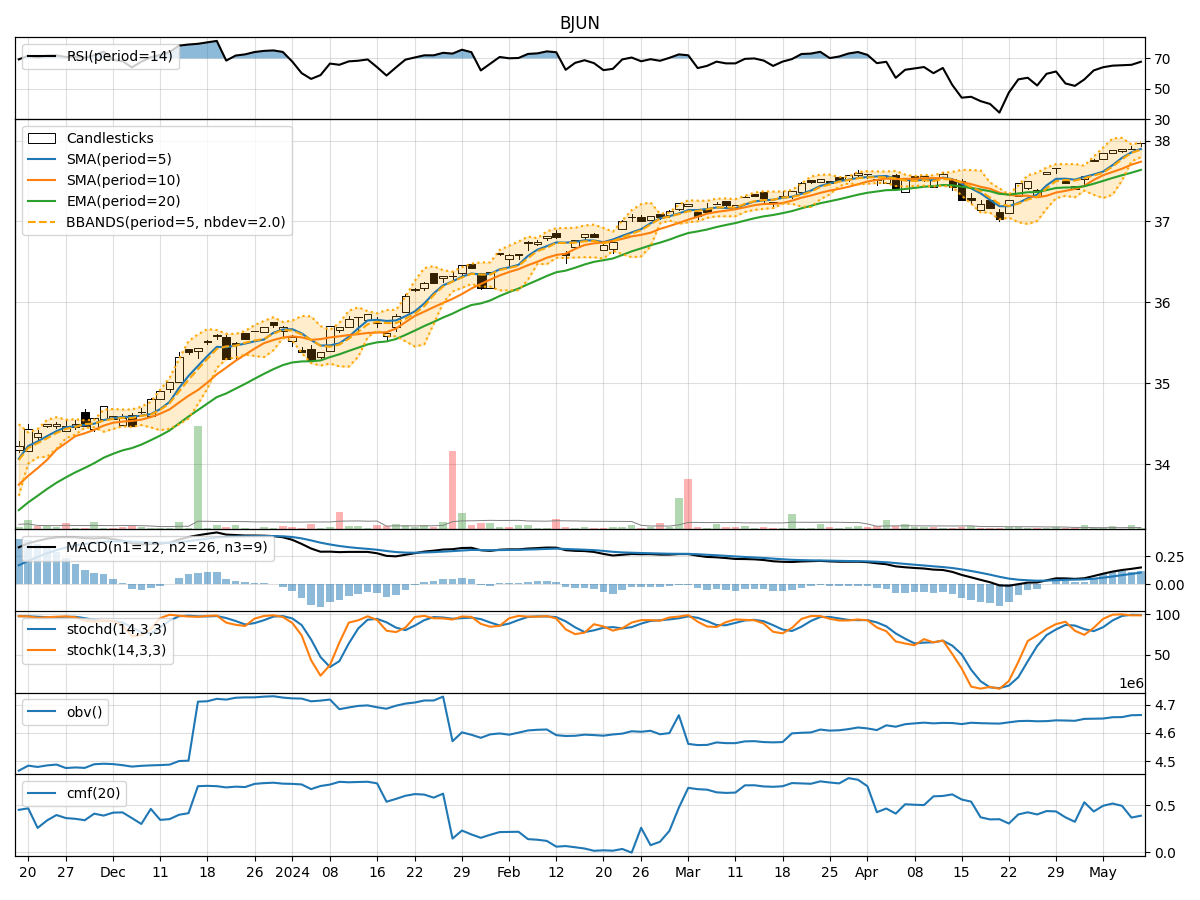
- Moving Averages (MA): The 5-day Moving Average (MA) has been consistently above the Simple Moving Average (SMA) and Exponential Moving Average (EMA), indicating a bullish trend.
- MACD: The MACD line has been consistently above the signal line, with both lines showing an upward trend, suggesting bullish momentum.
Momentum Analysis:
- RSI: The Relative Strength Index (RSI) has been in the overbought territory, indicating a strong bullish momentum.
- Stochastic Oscillator: Both %K and %D have been in the overbought zone, suggesting a potential reversal or consolidation.
Volatility Analysis:
- Bollinger Bands (BB): The stock price has been trading within the upper Bollinger Band, indicating an increased volatility and a potential overbought condition.
Volume Analysis:
- On-Balance Volume (OBV): The OBV has shown a slight increase over the last 5 days, indicating accumulation by investors.
- Chaikin Money Flow (CMF): The CMF has been positive but showing a slight decline, suggesting a potential weakening of buying pressure.
Key Observations:
- The trend indicators suggest a strong bullish sentiment in the short term.
- Momentum indicators indicate a potential overbought condition, signaling a need for caution.
- Volatility is increasing, which could lead to sharp price movements.
- Volume indicators show a slight increase in buying pressure but with a potential weakening trend.
Conclusion:
Based on the analysis of the technical indicators, the next few days for BJUN are likely to see continued upward movement in the stock price. However, caution is advised due to the overbought signals from the momentum indicators. Traders should closely monitor the price action for any signs of a potential reversal or consolidation.