Technical Analysis of BKCI 2024-05-10
Overview:
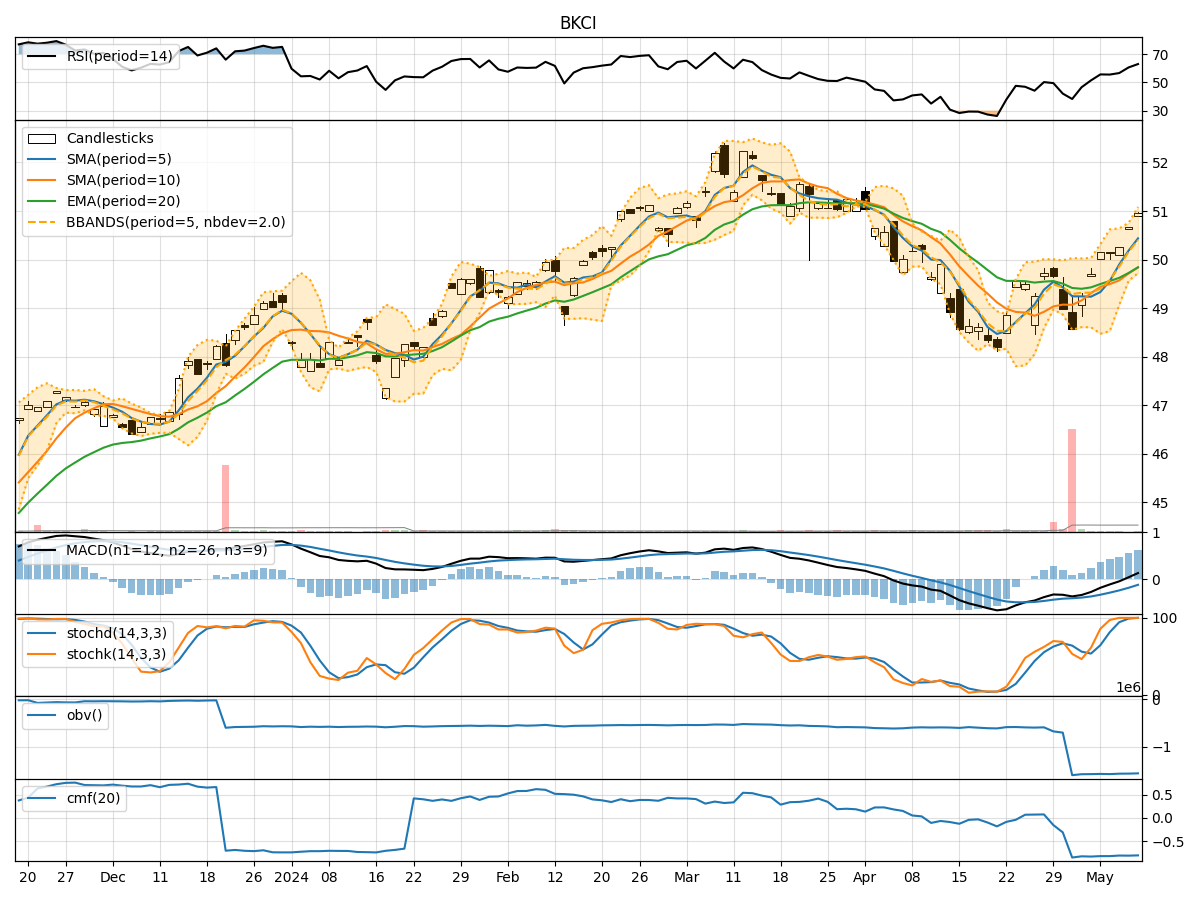
In analyzing the technical indicators for BKCI over the last 5 days, we will delve into the trend, momentum, volatility, and volume indicators to provide a comprehensive outlook on the possible stock price movement in the coming days. By examining these key indicators, we aim to offer valuable insights and predictions for informed decision-making.
Trend Indicators:
- Moving Averages (MA): The 5-day MA has been consistently above the closing prices, indicating a bullish trend.
- MACD: The MACD line has been consistently above the signal line, suggesting a bullish momentum.
- MACD Histogram: The histogram has been increasing, indicating strengthening bullish momentum.
Momentum Indicators:
- RSI: The RSI has been gradually increasing, indicating strengthening bullish momentum.
- Stochastic Oscillator: Both %K and %D have been consistently high, suggesting strong bullish momentum.
- Williams %R: The indicator has been hovering around oversold levels, indicating a potential reversal.
Volatility Indicators:
- Bollinger Bands (BB): The bands have been widening, indicating increased volatility.
- Bollinger %B: The %B has been fluctuating within the bands, suggesting potential price reversals.
Volume Indicators:
- On-Balance Volume (OBV): The OBV has been fluctuating, indicating mixed buying and selling pressure.
- Chaikin Money Flow (CMF): The CMF has been negative, suggesting overall selling pressure.
Key Observations:
- The trend indicators suggest a strong bullish trend with positive momentum.
- Momentum indicators indicate a continuation of bullish momentum.
- Volatility indicators show increased volatility in the stock price.
- Volume indicators reflect mixed buying and selling pressure.
Conclusion:
Based on the analysis of the technical indicators, the next few days' possible stock price movement for BKCI is likely to continue in an upward direction. The bullish trend, supported by positive momentum and increasing RSI, indicates a favorable outlook for the stock. However, investors should remain cautious of the increased volatility and mixed volume signals. Overall, the technical analysis points towards a bullish bias for BKCI in the coming days.