Technical Analysis of BKEM 2024-05-10
Overview:
In analyzing the technical indicators for BKEM over the last 5 days, we will delve into the trend, momentum, volatility, and volume indicators to provide a comprehensive outlook on the possible stock price movement in the coming days. By examining these key aspects, we aim to offer valuable insights and predictions for potential investors.
Trend Indicators:
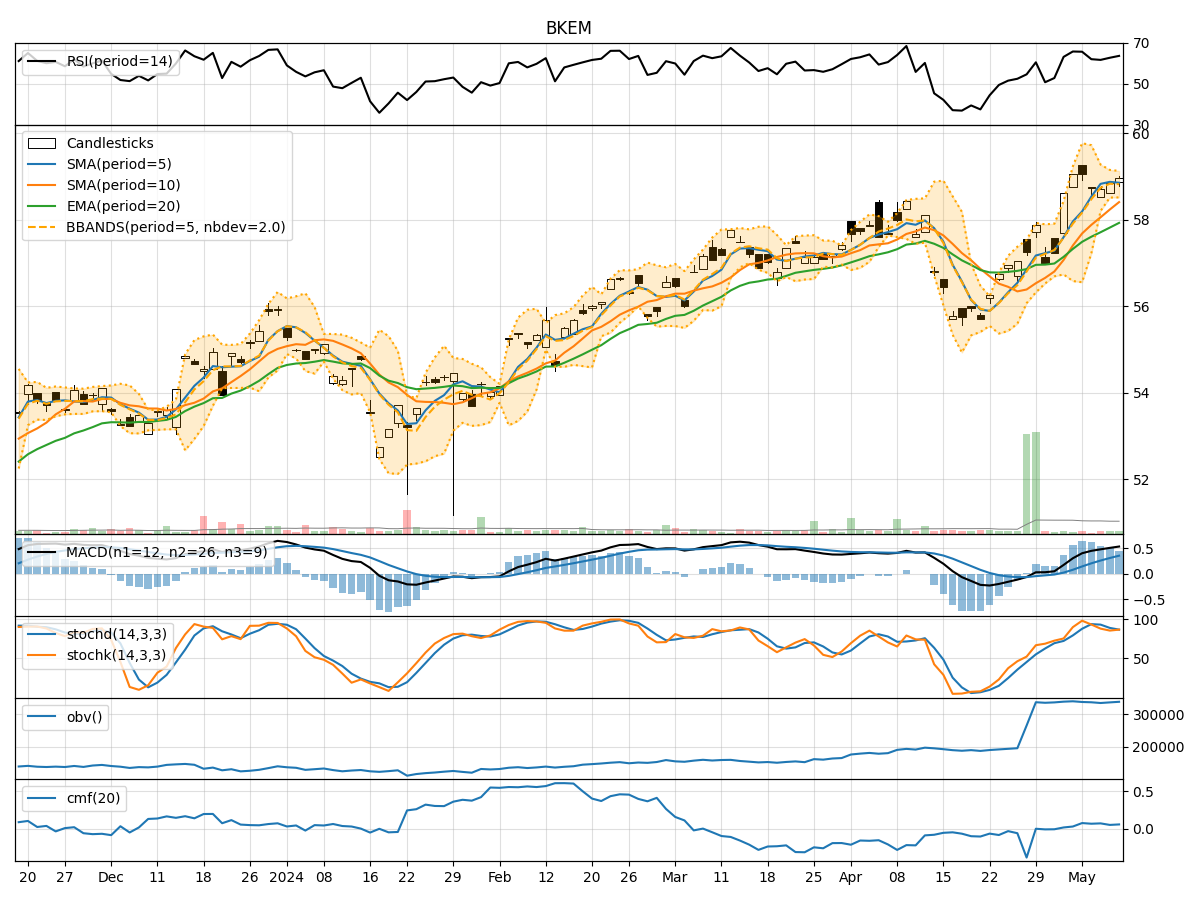
- Moving Averages (MA): The 5-day MA has been consistently above the closing prices, indicating a bullish trend.
- MACD: The MACD line has been above the signal line, suggesting a positive momentum in the stock.
- EMA: The EMA has been steadily increasing, reflecting a bullish sentiment in the market.
Momentum Indicators:
- RSI: The RSI values have been in the range of 60-70, indicating a moderate bullish momentum.
- Stochastic Oscillator: Both %K and %D values have been above 80, signaling an overbought condition.
- Williams %R: The values have been hovering around -10, indicating a potential reversal in the short term.
Volatility Indicators:
- Bollinger Bands: The stock price has been trading within the bands, suggesting a period of consolidation.
- Bollinger %B: The %B values have been fluctuating around 0.5, indicating a balanced market sentiment.
Volume Indicators:
- On-Balance Volume (OBV): The OBV values have been relatively stable, indicating a neutral volume flow.
- Chaikin Money Flow (CMF): The CMF values have been positive but not significantly strong, suggesting a cautious market sentiment.
Key Observations:
- The trend indicators show a strong bullish sentiment in the stock.
- Momentum indicators indicate a potential overbought condition and a need for caution.
- Volatility indicators suggest a period of consolidation and stability in the stock price.
- Volume indicators reflect a neutral volume flow without any significant buying or selling pressure.
Conclusion:
Based on the analysis of the technical indicators, the next few days' possible stock price movement for BKEM is likely to be sideways with a slight bearish bias. While the trend remains bullish, the overbought signals from momentum indicators and the consolidation pattern indicated by volatility indicators suggest a potential pullback or correction in the stock price. Investors should exercise caution and consider waiting for a better entry point before initiating new positions.