Technical Analysis of BKF 2024-05-10
Overview:
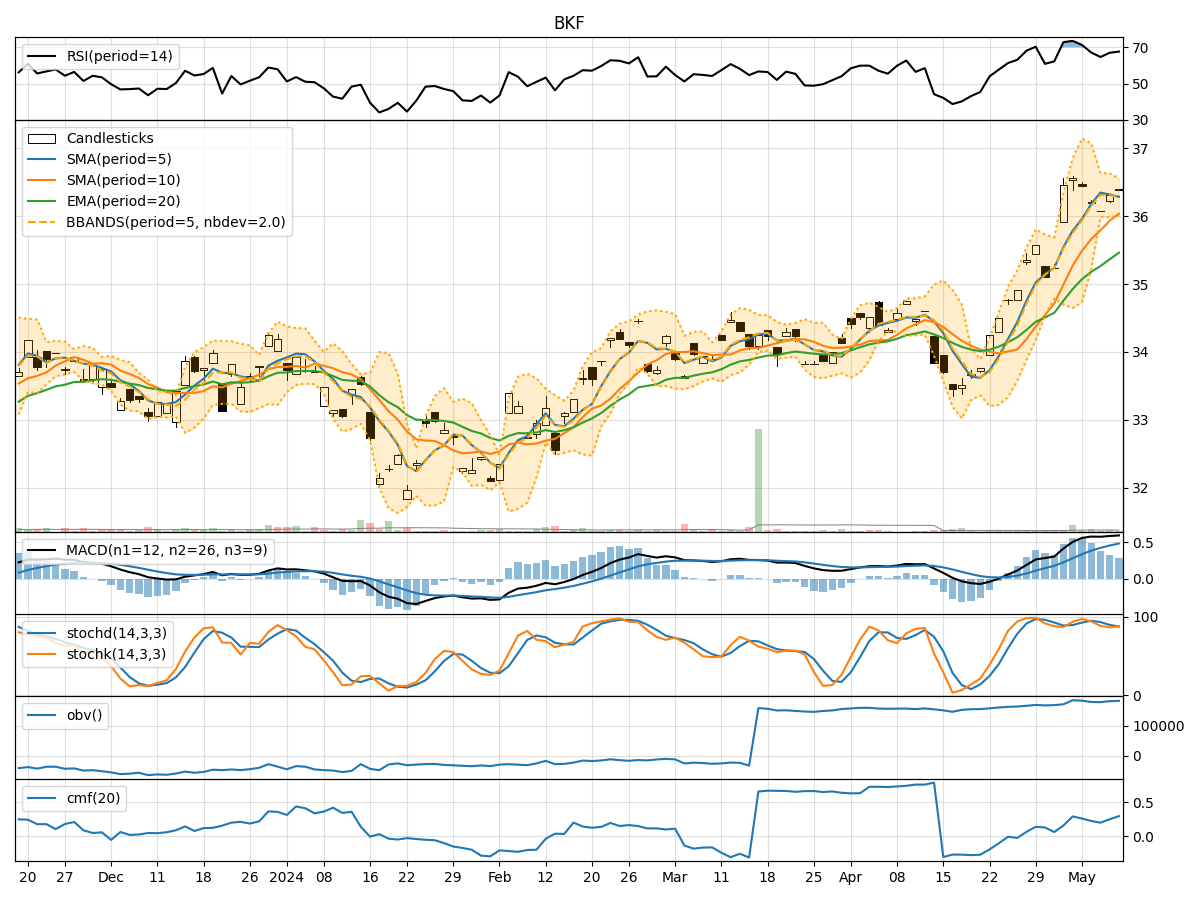
In analyzing the technical indicators for BKF stock over the last 5 days, we will delve into the trend, momentum, volatility, and volume indicators to provide a comprehensive outlook on the possible stock price movement in the coming days. By examining these key indicators, we aim to offer valuable insights and predictions for potential investors.
Trend Analysis:
- Moving Averages (MA): The 5-day Moving Average (MA) has been consistently above the Simple Moving Average (SMA) and Exponential Moving Average (EMA) over the past 5 days, indicating a bullish trend.
- MACD: The MACD line has been consistently above the signal line, with both lines showing an upward trend, suggesting bullish momentum in the stock price.
Momentum Analysis:
- RSI: The Relative Strength Index (RSI) has been fluctuating around the overbought territory, indicating strong buying pressure in the stock.
- Stochastic Oscillator: Both %K and %D lines of the Stochastic Oscillator have been in the overbought zone, suggesting a potential reversal or consolidation phase.
Volatility Analysis:
- Bollinger Bands (BB): The stock price has been trading within the upper Bollinger Band (BBU) range, indicating high volatility and a potential overbought condition.
Volume Analysis:
- On-Balance Volume (OBV): The OBV indicator has shown a slight increase over the last 5 days, suggesting accumulation of the stock by investors.
- Chaikin Money Flow (CMF): The CMF has been positive, indicating buying pressure in the stock.
Key Observations:
- The trend indicators suggest a bullish sentiment in the stock price, supported by the moving averages and MACD.
- Momentum indicators show a strong buying pressure, as indicated by the RSI and Stochastic Oscillator.
- Volatility indicators point towards high volatility and a potential overbought condition, as seen in the Bollinger Bands.
- Volume indicators reflect a positive accumulation of the stock by investors, supported by OBV and CMF.
Conclusion:
Based on the analysis of the technical indicators, the next few days' possible stock price movement for BKF is likely to continue in an upward direction. The bullish trend, strong momentum, and positive volume accumulation suggest that the stock price may experience further gains. However, caution should be exercised due to the high volatility and potential overbought condition indicated by the Bollinger Bands. Traders and investors should closely monitor the price action and key indicators for any signs of a reversal or consolidation phase.