Technical Analysis of BKGI 2024-05-10
Overview:
In analyzing the technical indicators for BKGI over the last 5 days, we will delve into the trend, momentum, volatility, and volume indicators to provide a comprehensive outlook on the possible stock price movement in the coming days. By examining these key indicators, we aim to offer valuable insights and recommendations for potential investors.
Trend Analysis:
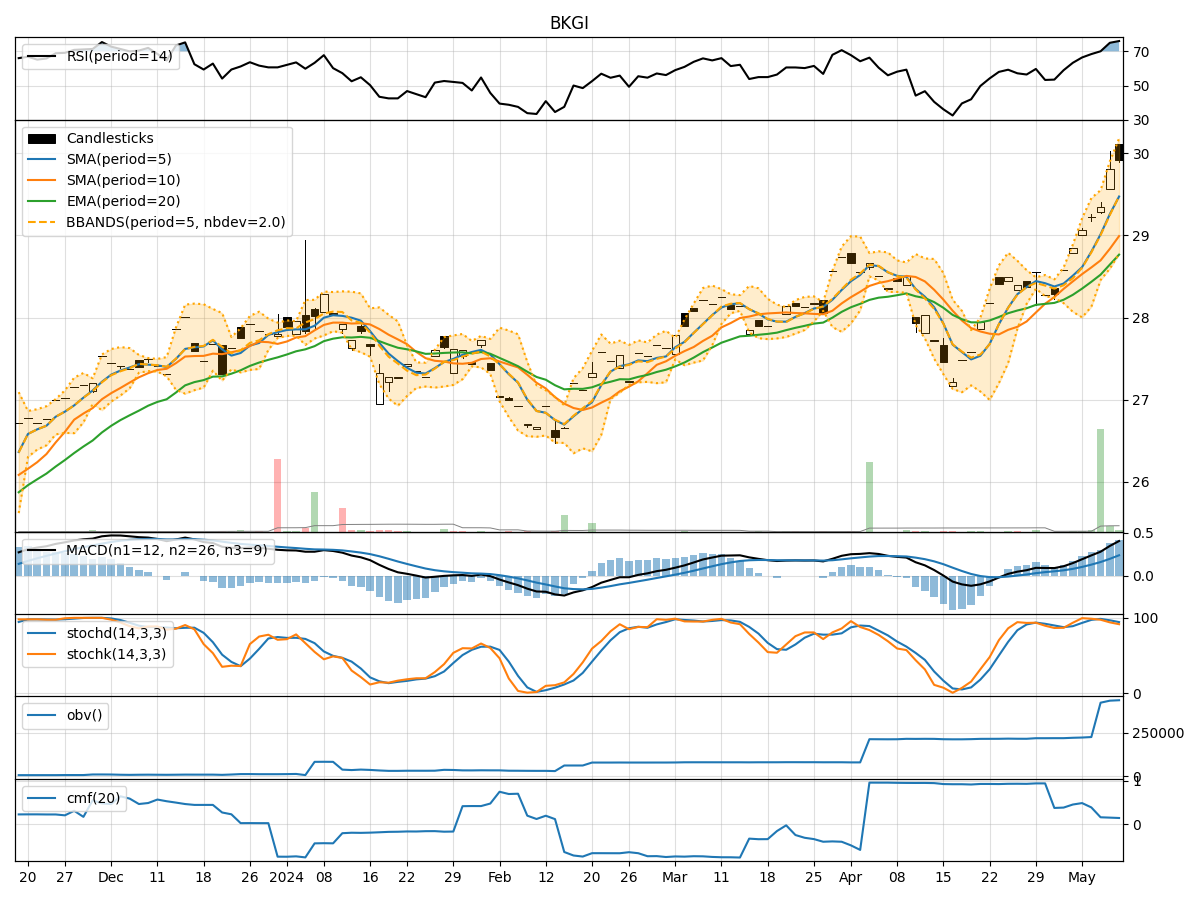
- Moving Averages (MA): The 5-day MA has been consistently above the 10-day SMA, indicating a short-term bullish trend.
- Exponential Moving Average (EMA): The EMA has been steadily increasing, reflecting positive price momentum.
- Moving Average Convergence Divergence (MACD): The MACD and signal line have been trending upwards, suggesting bullish momentum.
Momentum Analysis:
- Relative Strength Index (RSI): RSI values have been in the overbought territory, indicating a strong bullish momentum.
- Stochastic Oscillator: Both %K and %D have been declining but remain in the overbought zone, signaling a potential reversal.
- Williams %R (Willams %R): The Williams %R has been fluctuating in the oversold region, suggesting a possible reversal in the short term.
Volatility Analysis:
- Bollinger Bands (BB): The stock price has been trading within the upper Bollinger Band, indicating an overbought condition.
- Bollinger Band Width (BBW): The BBW has been relatively stable, suggesting a period of consolidation.
- Bollinger Band %B (BBP): The %B indicator has been hovering around 0.8, indicating a high price relative to the bands.
Volume Analysis:
- On-Balance Volume (OBV): The OBV has shown an overall positive trend, indicating accumulation by investors.
- Chaikin Money Flow (CMF): The CMF has been positive, suggesting buying pressure in the stock.
Conclusion:
Based on the analysis of the technical indicators, the stock of BKGI is currently in an overbought state with strong bullish momentum. However, the declining stochastic oscillator and fluctuating Williams %R signal a potential reversal in the short term. The stock price is likely to experience a pullback or consolidation in the coming days. Investors should exercise caution and consider waiting for a better entry point before initiating new positions.