Technical Analysis of BKHY 2024-05-10
Overview:
In analyzing the technical indicators for BKHY over the last 5 days, we will delve into the trend, momentum, volatility, and volume indicators to provide a comprehensive outlook on the possible stock price movement. By examining these key aspects, we aim to offer valuable insights and predictions for the upcoming days.
Trend Analysis:
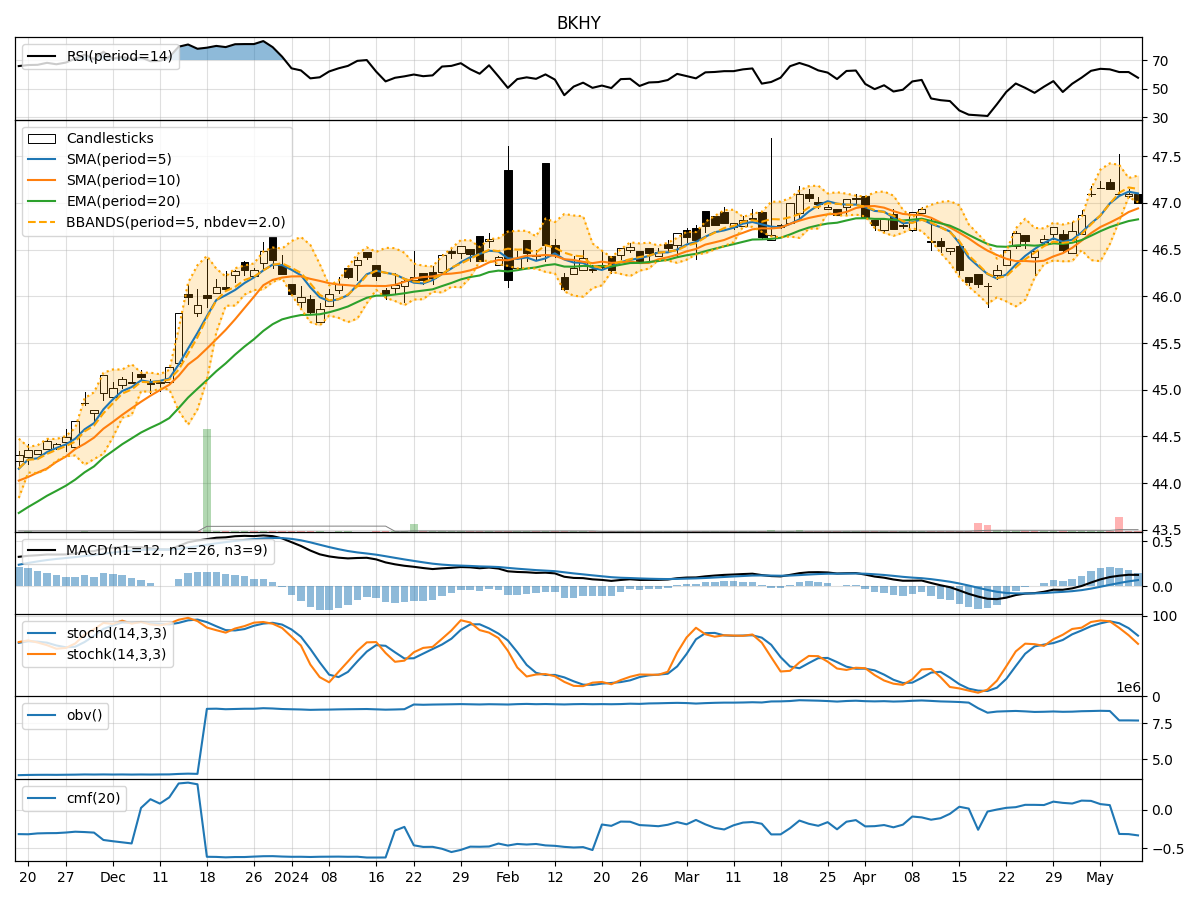
- Moving Averages (MA): The moving averages show a consistent uptrend with the closing price above the short-term moving averages, indicating positive momentum.
- MACD: The MACD line is above the signal line, suggesting a bullish trend.
- RSI: The RSI values are in the overbought territory, indicating a strong bullish momentum.
Key Observation: The trend indicators suggest a strong bullish sentiment in the stock.
Momentum Analysis:
- Stochastic Oscillator: The stochastic indicators are in the overbought region, signaling a potential reversal or consolidation.
- Williams %R (WillR): The WillR values are in the oversold region, indicating a possible reversal in the short term.
Key Observation: Momentum indicators are mixed, with stochastic suggesting a potential reversal while WillR indicates oversold conditions.
Volatility Analysis:
- Bollinger Bands (BB): The stock price has been trading within the Bollinger Bands, indicating normal volatility.
- Bollinger Band Width (BBW): The band width has been relatively stable, suggesting consistent volatility levels.
Key Observation: Volatility indicators show stable price movements within the bands, indicating a lack of significant volatility.
Volume Analysis:
- On-Balance Volume (OBV): The OBV has been declining, indicating selling pressure in the stock.
- Chaikin Money Flow (CMF): The CMF is negative, suggesting outflow of money from the stock.
Key Observation: Volume indicators reflect a bearish sentiment with decreasing OBV and negative CMF values.
Conclusion:
Based on the analysis of the technical indicators, the stock is likely to experience a short-term consolidation or a minor pullback due to the mixed signals from momentum indicators and the bearish sentiment in volume indicators. However, the overall trend remains bullish as indicated by the moving averages, MACD, and RSI.
Recommendation: Traders may consider taking profits or adopting a cautious approach in the short term, while long-term investors can hold their positions considering the overall bullish trend. Monitoring the stochastic indicators for a potential reversal signal would be advisable.
In summary, while short-term volatility and consolidation are possible, the overall outlook for BKHY remains bullish based on the current technical analysis.