Technical Analysis of BKIV 2024-05-10
Overview:
In analyzing the technical indicators for BKIV over the last 5 days, we will delve into the trend, momentum, volatility, and volume indicators to provide a comprehensive outlook on the possible stock price movement in the coming days.
Trend Indicators:
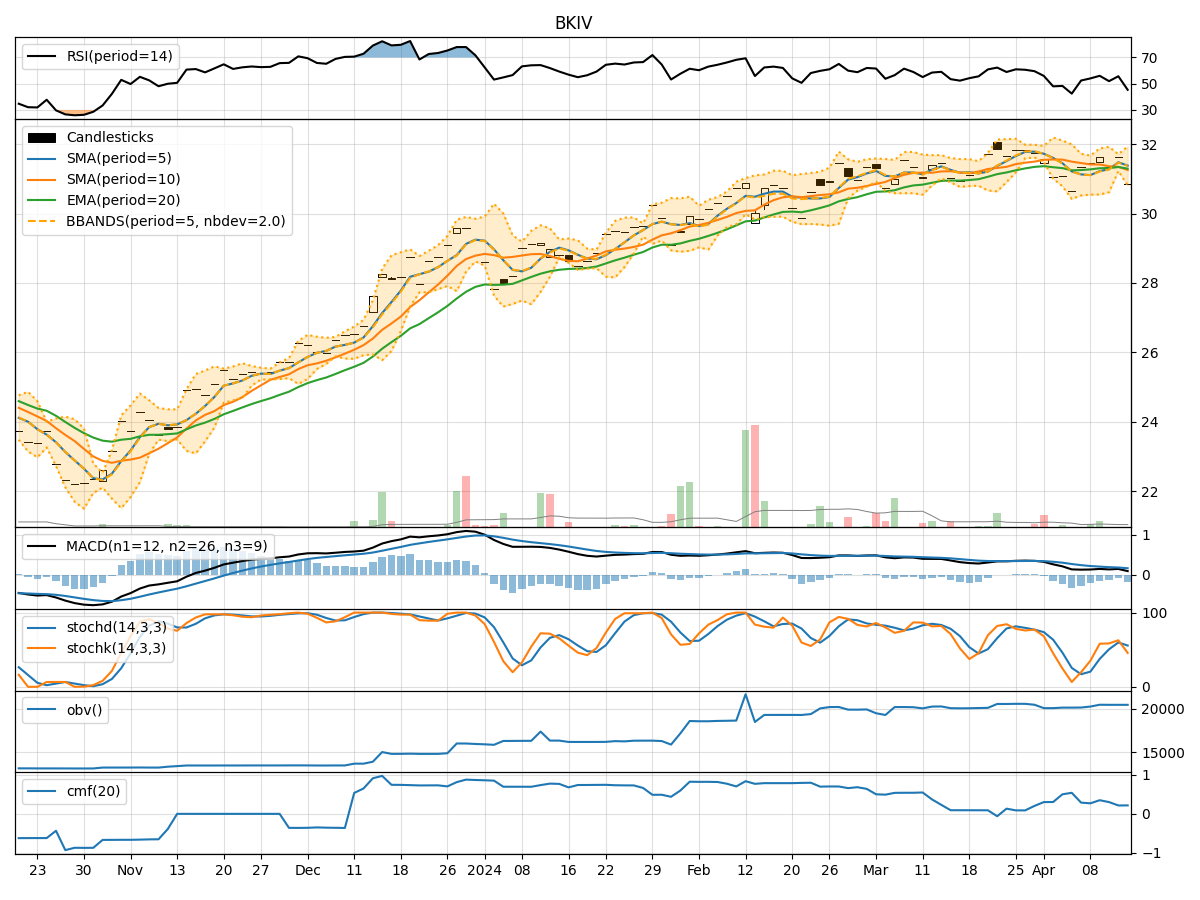
- Moving Averages (MA): The 5-day Moving Average (MA) has been consistently above the Simple Moving Average (SMA) and Exponential Moving Average (EMA), indicating a bullish trend.
- MACD: The Moving Average Convergence Divergence (MACD) has shown positive values, with the MACD line consistently above the Signal line, suggesting upward momentum.
Momentum Indicators:
- RSI: The Relative Strength Index (RSI) has been fluctuating around the neutral zone, indicating indecision in the market.
- Stochastic Oscillator: Both %K and %D have been declining, signaling a potential bearish momentum.
Volatility Indicators:
- Bollinger Bands (BB): The stock price has been trading within the Bollinger Bands, with the bands narrowing, suggesting a decrease in volatility.
Volume Indicators:
- On-Balance Volume (OBV): The OBV has been relatively stable, indicating a balance between buying and selling pressure.
- Chaikin Money Flow (CMF): The CMF has been positive but decreasing, suggesting a potential weakening of buying pressure.
Key Observations:
- The trend indicators point towards a bullish sentiment in the short term.
- Momentum indicators show a mixed signal with a slight bearish bias.
- Volatility has been decreasing, indicating a possible period of consolidation.
- Volume indicators suggest a balanced market sentiment with a slight decrease in buying pressure.
Conclusion:
Based on the analysis of the technical indicators, the next few days for BKIV stock price movement could see sideways consolidation with a slight bearish bias. Traders should exercise caution and closely monitor key support and resistance levels for potential entry or exit points.