Technical Analysis of BKMC 2024-05-10
Overview:
In analyzing the technical indicators for BKMC over the last 5 days, we will delve into the trend, momentum, volatility, and volume indicators to provide a comprehensive outlook on the possible stock price movement in the coming days.
Trend Indicators:
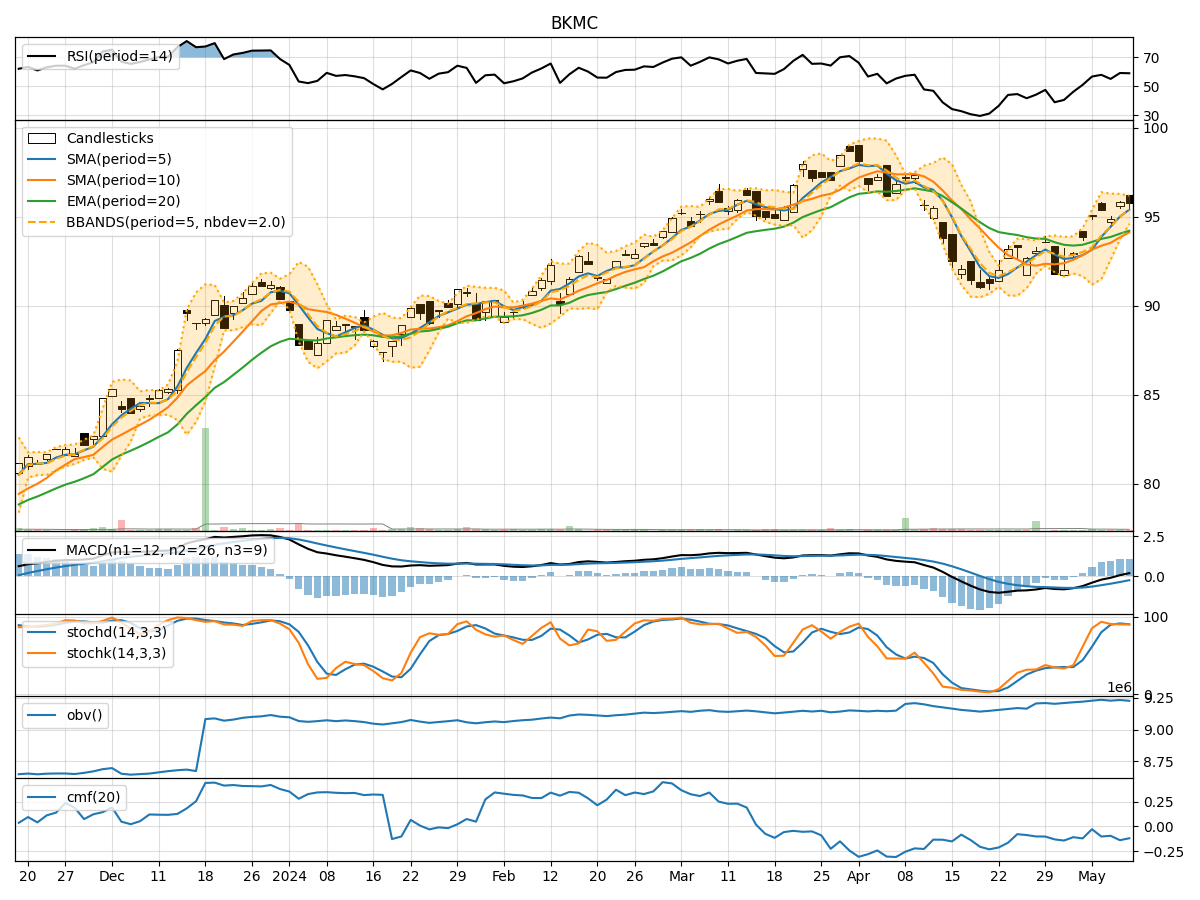
- Moving Averages (MA): The 5-day Moving Average (MA) has been consistently above the Simple Moving Average (SMA) and Exponential Moving Average (EMA), indicating a bullish trend.
- MACD: The MACD line has been consistently above the signal line, with both lines showing an upward trend, suggesting bullish momentum.
- MACD Histogram: The MACD Histogram has been increasing over the past 5 days, indicating strengthening bullish momentum.
Momentum Indicators:
- RSI: The Relative Strength Index (RSI) has been fluctuating around the 50 level, indicating a neutral momentum.
- Stochastic Oscillator: Both %K and %D lines of the Stochastic Oscillator have been hovering in the overbought territory, suggesting a potential reversal or consolidation.
- Williams %R: The Williams %R has been fluctuating around the oversold territory, indicating a mixed momentum.
Volatility Indicators:
- Bollinger Bands: The stock price has been trading within the Bollinger Bands, with the bands narrowing, suggesting a period of consolidation.
- Bollinger %B: The %B indicator has been fluctuating around the middle range, indicating a neutral volatility.
Volume Indicators:
- On-Balance Volume (OBV): The OBV has been fluctuating, indicating indecision among market participants.
- Chaikin Money Flow (CMF): The CMF has been negative, suggesting selling pressure in the stock.
Key Observations:
- The trend indicators suggest a strong bullish sentiment in the stock.
- Momentum indicators show mixed signals with potential for a reversal or consolidation.
- Volatility indicators point towards a period of consolidation.
- Volume indicators indicate indecision among investors with selling pressure.
Conclusion:
Based on the analysis of the technical indicators, the next few days' possible stock price movement for BKMC is likely to be sideways with a slight bearish bias. The bullish trend may face resistance due to mixed momentum signals and selling pressure indicated by volume indicators. Traders should exercise caution and consider waiting for clearer signals before making significant trading decisions.