Technical Analysis of BKUI 2024-05-10
Overview:
In analyzing the technical indicators for BKUI stock over the last 5 days, we will delve into the trend, momentum, volatility, and volume indicators to provide a comprehensive outlook on the possible future stock price movement. By examining these key indicators, we aim to offer valuable insights and recommendations for potential investors.
Trend Analysis:
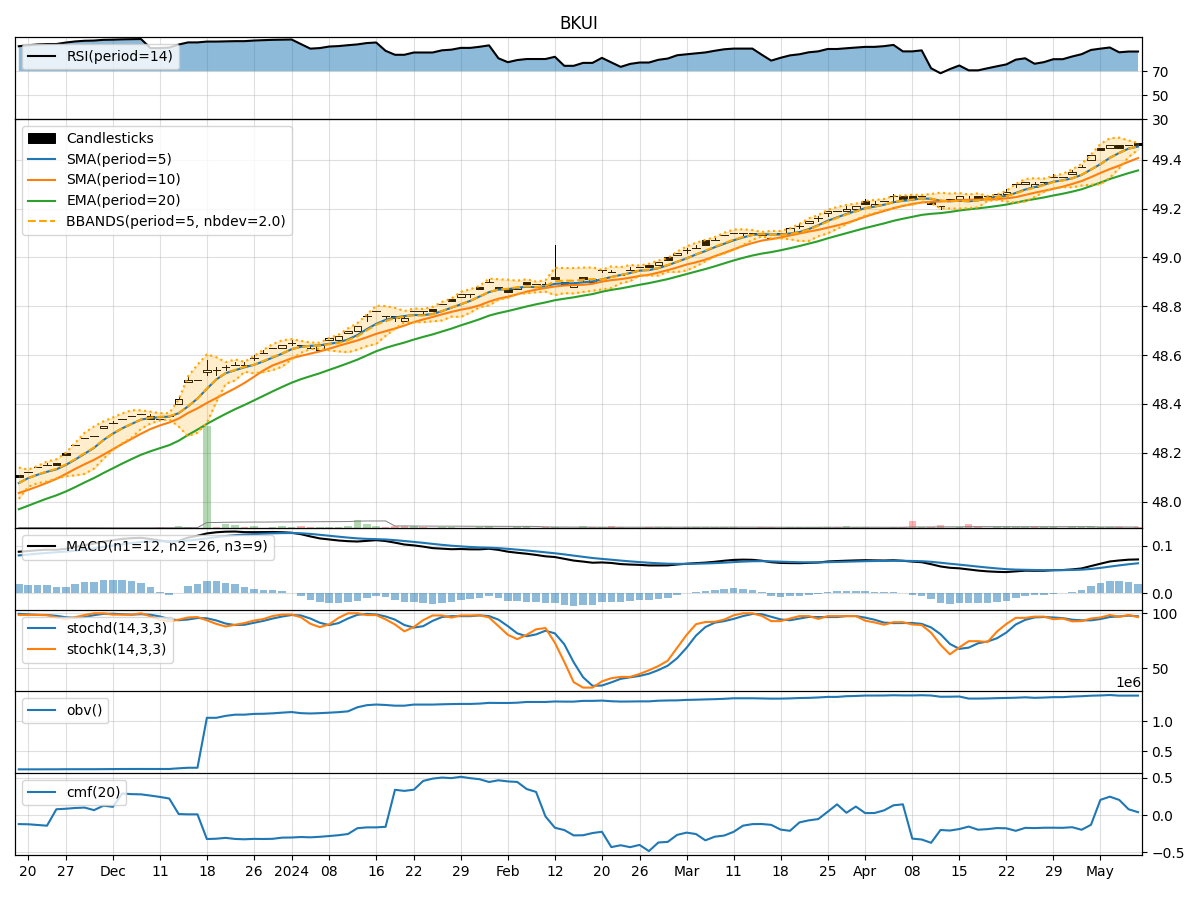
- Moving Averages (MA): The 5-day Moving Average (MA) has been consistently above the Simple Moving Average (SMA) and Exponential Moving Average (EMA), indicating a bullish trend.
- MACD: The Moving Average Convergence Divergence (MACD) has shown positive values, with the MACD line consistently above the Signal line, suggesting upward momentum.
Momentum Analysis:
- RSI: The Relative Strength Index (RSI) has been in the overbought territory, indicating a strong bullish momentum.
- Stochastic Oscillator: Both %K and %D lines of the Stochastic Oscillator have been in the overbought zone, signaling a strong buying pressure.
Volatility Analysis:
- Bollinger Bands (BB): The Bollinger Bands have shown a narrowing of the bands, indicating decreasing volatility and a potential price breakout.
Volume Analysis:
- On-Balance Volume (OBV): The OBV has been relatively stable, suggesting consistent buying interest in the stock.
- Chaikin Money Flow (CMF): The CMF has shown positive values, indicating a bullish money flow into the stock.
Key Observations:
- The trend indicators suggest a strong bullish sentiment in the stock, supported by the positive MACD and moving averages.
- Momentum indicators like RSI and Stochastic Oscillator point towards an overbought condition, indicating a potential correction or consolidation.
- Volatility has been decreasing, as shown by the narrowing Bollinger Bands, which could precede a significant price movement.
- Volume indicators reflect consistent buying interest, as seen in the stable OBV and positive CMF values.
Conclusion:
Based on the analysis of the technical indicators, the next few days' possible stock price movement for BKUI is likely to be upward in the short term. However, considering the overbought conditions in the momentum indicators, there might be a consolidation or correction phase before further upside potential. Traders should closely monitor the price action for potential entry or exit points, keeping a watchful eye on key support and resistance levels for strategic decision-making.