Technical Analysis of BKWO 2024-05-10
Overview:
In analyzing the technical indicators for BKWO over the last 5 days, we will delve into the trend, momentum, volatility, and volume indicators to provide a comprehensive outlook on the possible stock price movement in the coming days.
Trend Analysis:
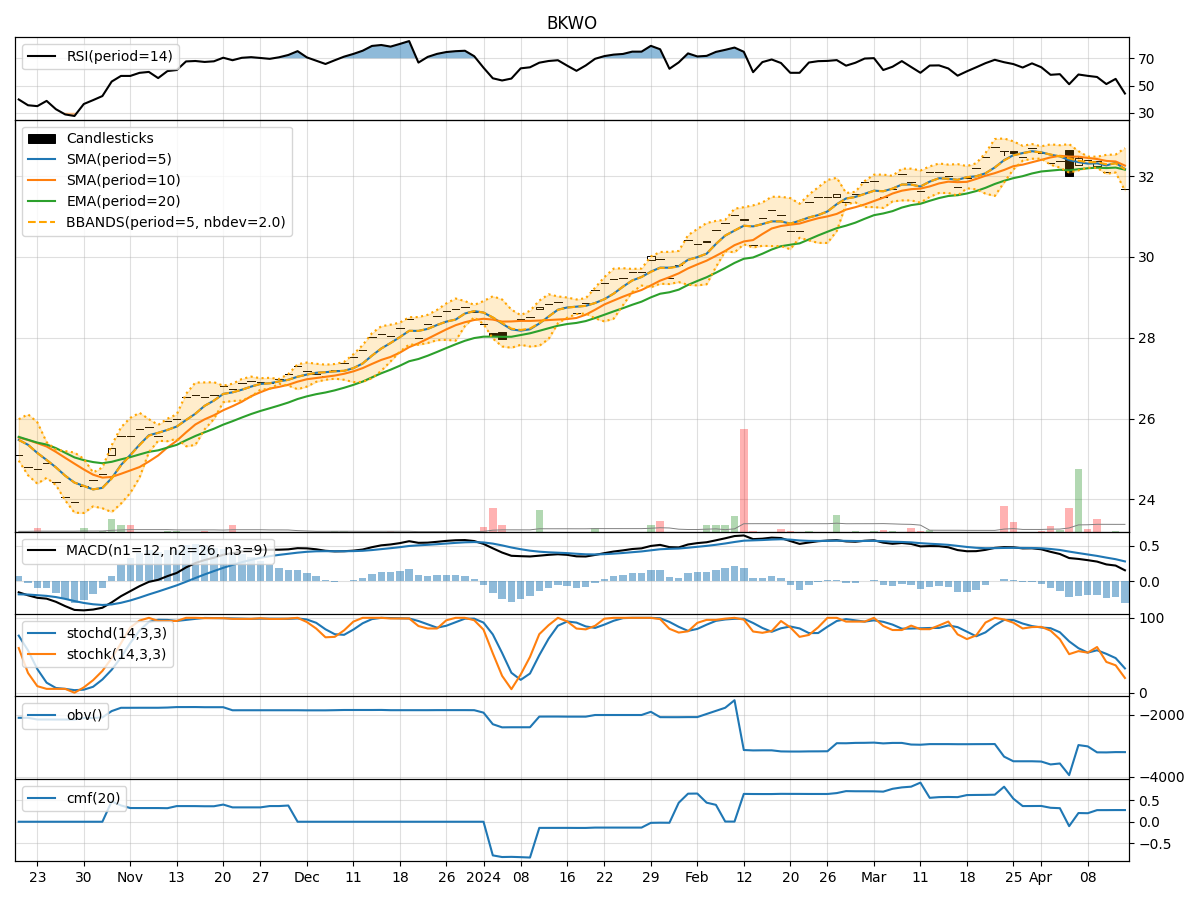
- Moving Averages (MA): The 5-day Moving Average (MA) has been consistently above the Simple Moving Average (SMA) and Exponential Moving Average (EMA), indicating a short-term bullish trend.
- MACD: The Moving Average Convergence Divergence (MACD) has been positive, with the MACD line above the Signal line, suggesting bullish momentum.
Momentum Analysis:
- RSI: The Relative Strength Index (RSI) has been fluctuating around the 50 level, indicating a neutral momentum.
- Stochastic Oscillator: The Stochastic Oscillator shows a mix of overbought and oversold conditions, suggesting potential reversals in momentum.
Volatility Analysis:
- Bollinger Bands (BB): The Bollinger Bands have been narrowing, indicating decreasing volatility and a potential breakout in price.
Volume Analysis:
- On-Balance Volume (OBV): The OBV has been slightly negative, suggesting some distribution of shares.
- Chaikin Money Flow (CMF): The CMF has been negative, indicating selling pressure in the market.
Key Observations:
- The trend indicators suggest a short-term bullish bias.
- Momentum indicators show a neutral stance with potential for reversals.
- Volatility is decreasing, signaling a possible consolidation phase.
- Volume indicators point towards some distribution and selling pressure.
Conclusion:
Based on the analysis of the technical indicators, the next few days for BKWO could see sideways movement with a slight bearish bias. Traders should watch for potential reversals in momentum indicated by the Stochastic Oscillator and monitor the Bollinger Bands for a breakout signal. It is advisable to exercise caution and wait for clearer signals before making significant trading decisions.