Technical Analysis of BLCN 2024-05-10
Overview:
In analyzing the technical indicators for BLCN over the last 5 days, we will delve into the trend, momentum, volatility, and volume indicators to provide a comprehensive outlook on the possible stock price movement. By examining these key indicators, we aim to offer valuable insights and predictions for the upcoming days.
Trend Indicators:
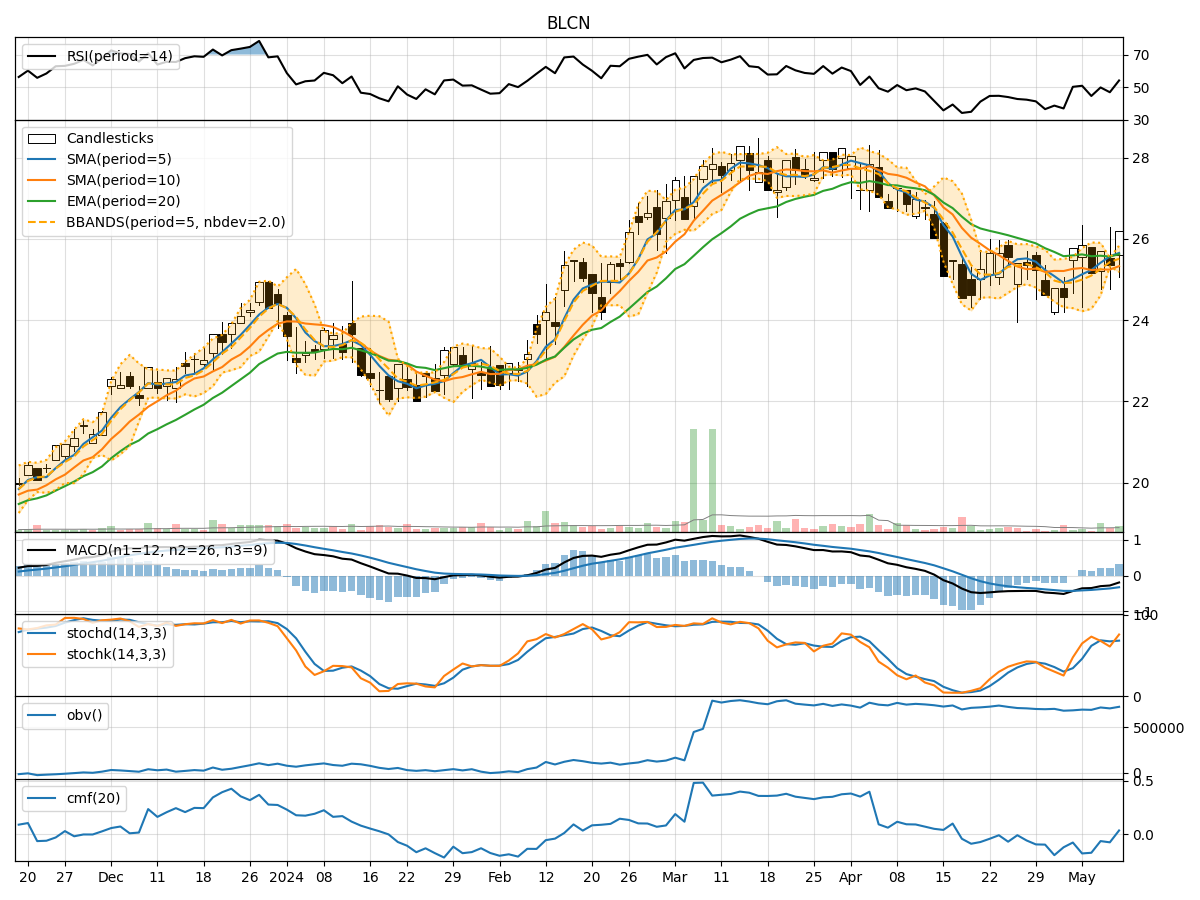
- Moving Averages (MA): The 5-day Moving Average (MA) has been fluctuating around the closing prices, indicating short-term price trends. The Simple Moving Average (SMA) and Exponential Moving Average (EMA) show a slight convergence, suggesting potential stability in the price movement.
- MACD: The Moving Average Convergence Divergence (MACD) has been negative but showing signs of improvement, with the MACD line approaching the signal line. This could indicate a potential shift towards a bullish momentum.
Momentum Indicators:
- RSI: The Relative Strength Index (RSI) has been oscillating around the midline, indicating a balanced momentum between buying and selling pressure.
- Stochastic Oscillator: The Stochastic Oscillator reflects a mix of overbought and oversold conditions, with recent values leaning towards overbought territory. This could suggest a potential reversal in the short term.
Volatility Indicators:
- Bollinger Bands (BB): The Bollinger Bands have shown narrowing bands, indicating decreasing volatility. The price has been trading within the bands, suggesting a period of consolidation.
- Bollinger %B (BBP): The %B indicator is hovering around the midpoint, reflecting a neutral stance in terms of volatility.
Volume Indicators:
- On-Balance Volume (OBV): The OBV has been relatively stable, indicating a balance between buying and selling pressure.
- Chaikin Money Flow (CMF): The CMF has been negative but improving slightly, suggesting a potential influx of money into the stock.
Key Observations and Opinions:
- Trend: The trend indicators show a potential shift towards a bullish sentiment, with moving averages converging and the MACD line approaching the signal line.
- Momentum: The momentum indicators suggest a balanced momentum with a slight inclination towards overbought conditions, indicating a possible short-term correction.
- Volatility: Volatility has been decreasing, leading to a period of consolidation within the Bollinger Bands.
- Volume: The volume indicators reflect a stable volume with a slight improvement in the Chaikin Money Flow.
Conclusion:
Based on the analysis of the technical indicators, the next few days for BLCN could see sideways movement with a slight bullish bias. Traders may expect the stock price to consolidate within a range, potentially experiencing a minor uptick in the short term. It is advisable to closely monitor the price action and key support/resistance levels for potential trading opportunities.