Technical Analysis of BLCR 2024-05-10
Overview:
In analyzing the technical indicators for BLCR stock over the last 5 days, we will delve into the trend, momentum, volatility, and volume indicators to provide a comprehensive outlook on the possible stock price movement in the coming days. By examining these key indicators, we aim to offer valuable insights and predictions for potential investors.
Trend Analysis:
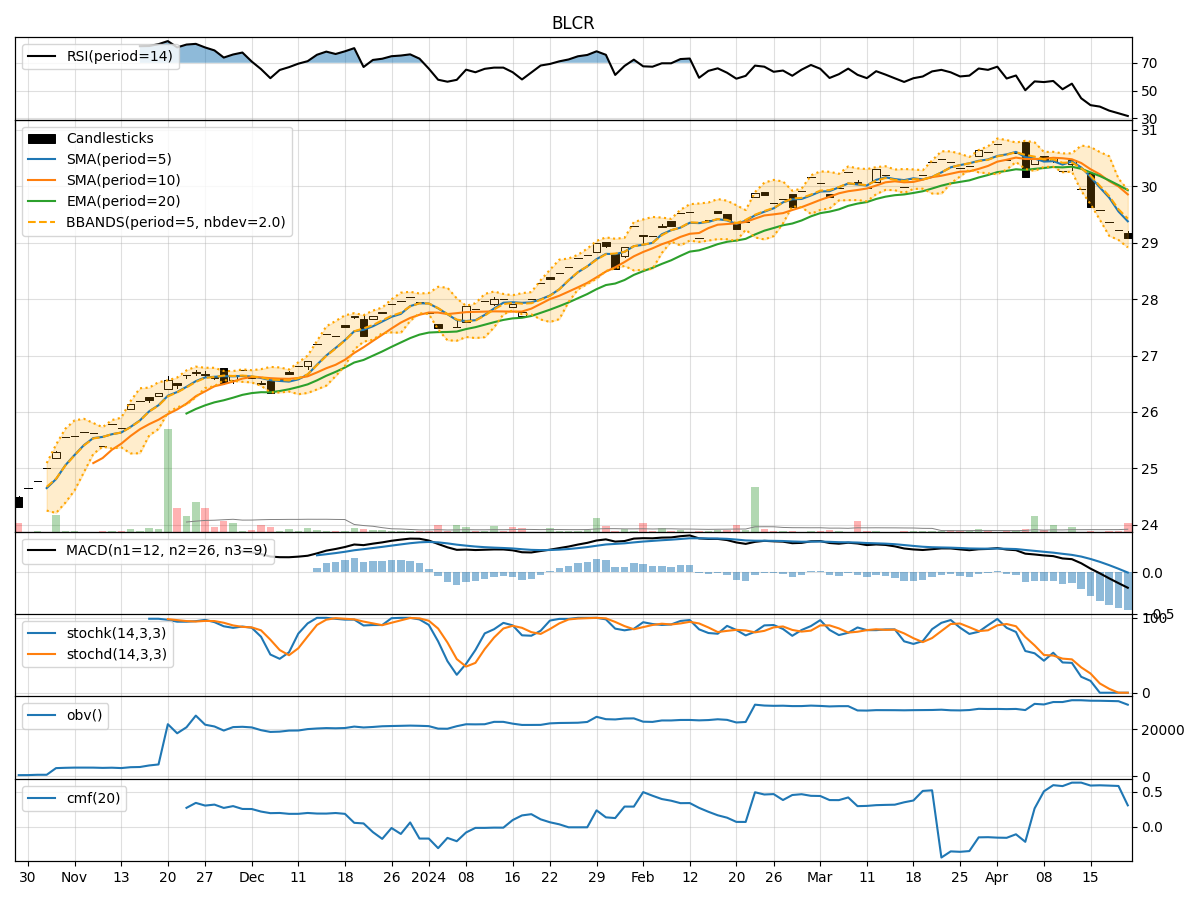
- Moving Averages (MA): The 5-day Moving Average (MA) has been consistently above the Simple Moving Average (SMA) and Exponential Moving Average (EMA), indicating a bullish trend.
- MACD: The MACD line has been consistently above the signal line, with the MACD histogram showing an increasing positive trend, suggesting bullish momentum.
Momentum Analysis:
- RSI: The Relative Strength Index (RSI) has been hovering around 60-62, indicating a neutral to slightly bullish momentum.
- Stochastic Oscillator: Both %K and %D have been consistently high, suggesting strong buying pressure.
- Williams %R: The Williams %R is close to 0, indicating a potential overbought condition.
Volatility Analysis:
- Bollinger Bands (BB): The stock price has been trading within the upper Bollinger Band, suggesting an overbought condition.
- Bollinger %B: The %B indicator is above 0.8, indicating a high volatility and potential reversal.
Volume Analysis:
- On-Balance Volume (OBV): The OBV has shown a slight increase over the last few days, indicating accumulation by investors.
- Chaikin Money Flow (CMF): The CMF has been negative, suggesting a bearish money flow trend.
Conclusion:
Based on the analysis of the technical indicators, the stock of BLCR is currently exhibiting bullish signals in terms of trend and momentum, with a potential overbought condition indicated by the volatility indicators. The volume indicators show a mixed signal with slight accumulation but bearish money flow.
Possible Stock Price Movement:
Considering the overall bullish trend and momentum, the stock price of BLCR is likely to continue its upward trajectory in the coming days. However, caution is advised due to the overbought condition indicated by the Bollinger Bands and the potential for a reversal suggested by the %B indicator. Investors should closely monitor the price action and consider taking profits or implementing risk management strategies to navigate potential volatility.