Technical Analysis of BLCV 2024-05-10
Overview:
In analyzing the technical indicators for BLCV over the last 5 days, we will delve into the trend, momentum, volatility, and volume indicators to provide a comprehensive outlook on the possible stock price movement in the coming days. By examining these key aspects, we aim to offer valuable insights and predictions to guide your investment decisions.
Trend Indicators:
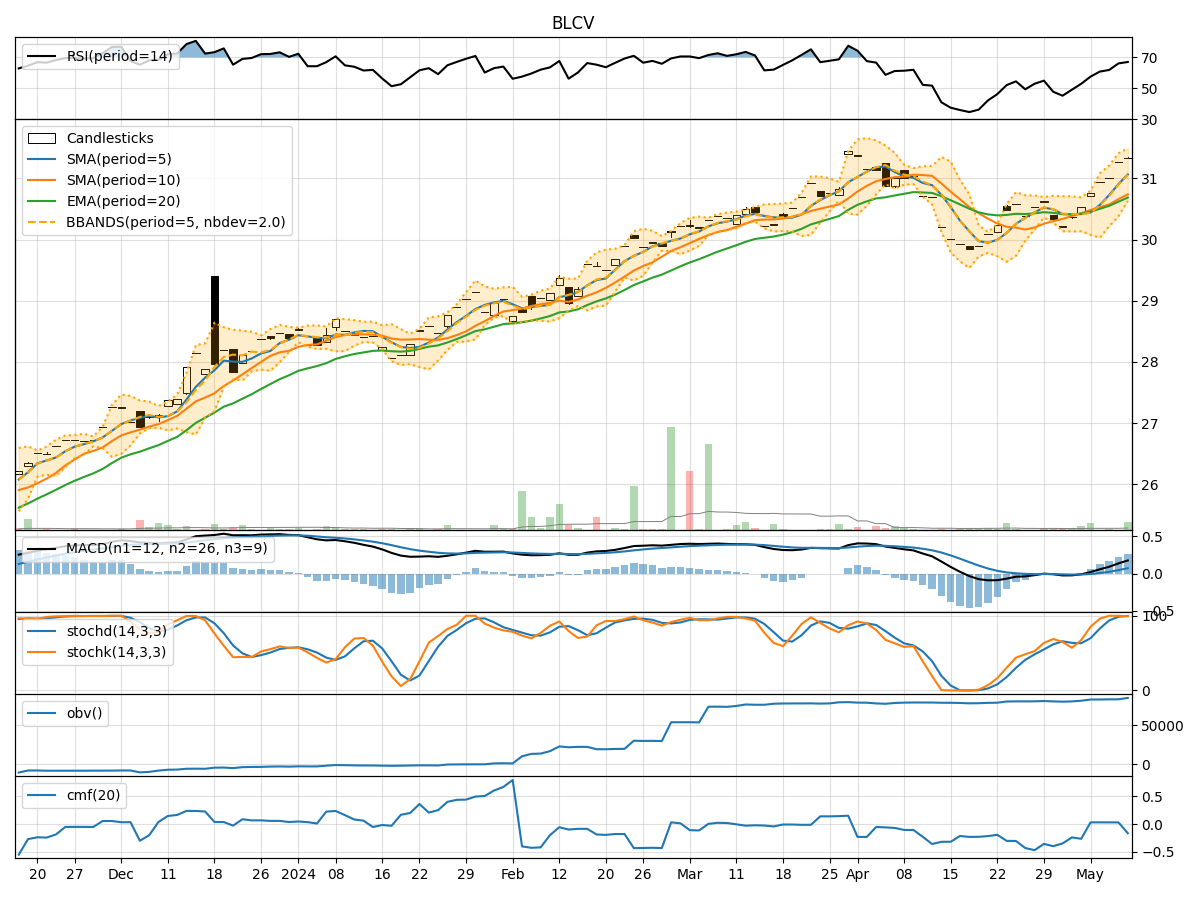
- Moving Averages (MA): The 5-day Moving Average (MA) has been consistently above the Simple Moving Average (SMA) and Exponential Moving Average (EMA), indicating a bullish trend.
- MACD: The MACD line has been consistently above the signal line, with both lines showing an upward trend, suggesting bullish momentum.
- MACD Histogram: The MACD Histogram has been increasing over the past 5 days, indicating strengthening bullish momentum.
Momentum Indicators:
- RSI: The Relative Strength Index (RSI) has been trending upwards and is currently in the overbought territory, suggesting a strong bullish momentum.
- Stochastic Oscillator: Both %K and %D lines of the Stochastic Oscillator are in the overbought zone, indicating a potential reversal or consolidation.
- Williams %R: The Williams %R is in the oversold territory, signaling a potential reversal to the upside.
Volatility Indicators:
- Bollinger Bands: The stock price has been trading within the Bollinger Bands, with the bands widening slightly, indicating increased volatility.
- Bollinger %B: The %B indicator is below 1, suggesting that the stock price is trading below the upper Bollinger Band, potentially indicating a buying opportunity.
- Bollinger Band Width: The Band Width has been expanding, indicating increased volatility in the stock price.
Volume Indicators:
- On-Balance Volume (OBV): The OBV has been trending upwards, indicating that volume has been higher on up days compared to down days.
- Chaikin Money Flow (CMF): The CMF is positive but has been decreasing, suggesting a potential decrease in buying pressure.
Key Observations and Opinions:
- Trend: The trend indicators suggest a strong bullish sentiment in the stock, supported by moving averages and MACD analysis.
- Momentum: Momentum indicators indicate a strong bullish momentum, but the Stochastic Oscillator signals a potential reversal or consolidation.
- Volatility: Volatility has been increasing, which could lead to larger price swings in the coming days.
- Volume: The increasing OBV indicates accumulation, but the decreasing CMF raises a cautionary flag.
Conclusion:
Based on the analysis of the technical indicators, the stock is currently in a strong bullish trend with positive momentum. However, the overbought conditions in some indicators and the potential reversal signals from the Stochastic Oscillator suggest a possible short-term consolidation or pullback. Traders should monitor the price action closely for signs of a reversal or continuation of the bullish trend.