Technical Analysis of BLDG 2024-05-10
Overview:
In analyzing the technical indicators for BLDG stock over the last 5 days, we will delve into the trends, momentum, volatility, and volume indicators to provide a comprehensive outlook on the possible stock price movement in the coming days. By examining these key factors, we aim to offer valuable insights and predictions for potential investors.
Trend Analysis:
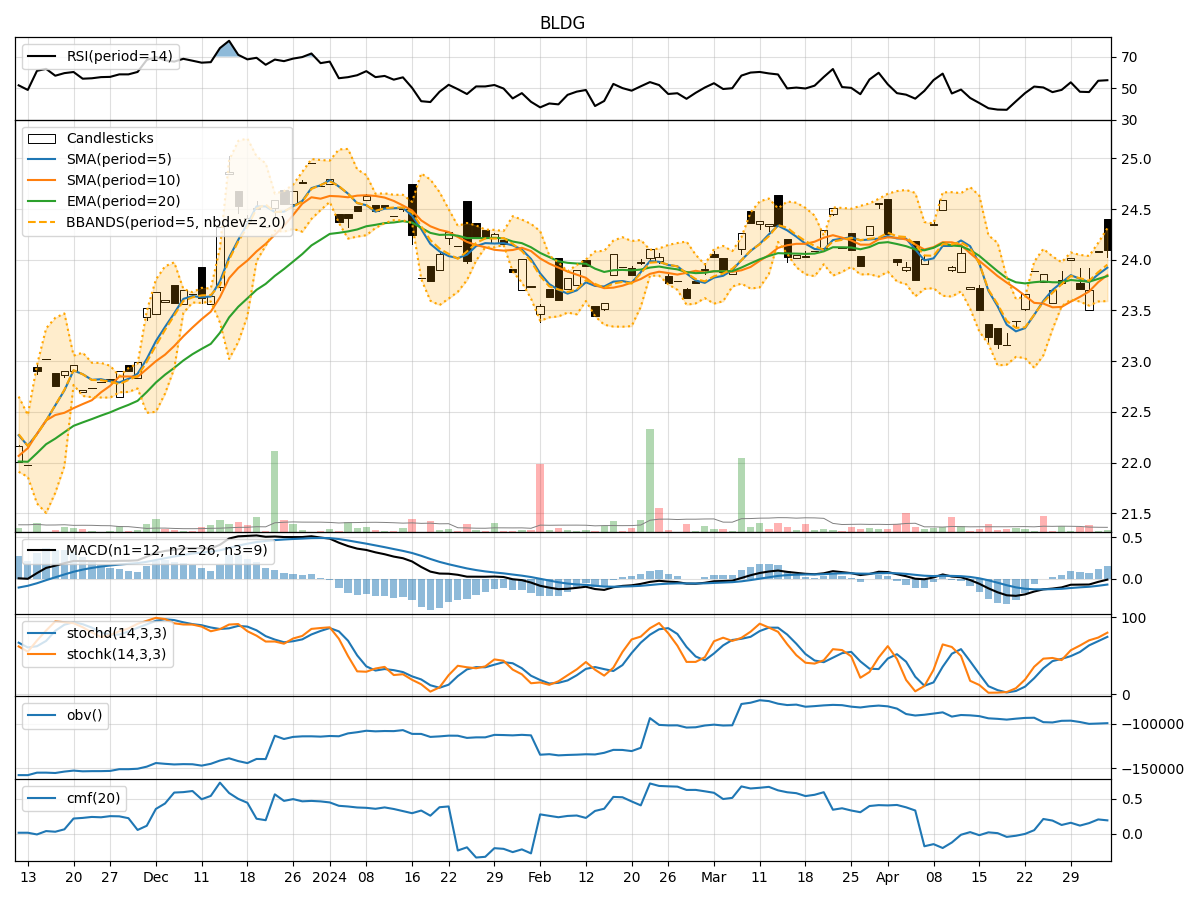
- Moving Averages (MA): The 5-day Moving Average (MA) has been consistently above the Simple Moving Average (SMA) and Exponential Moving Average (EMA), indicating a bullish trend.
- MACD: The MACD line has been consistently above the signal line, suggesting a positive momentum in the stock price.
- RSI: The Relative Strength Index (RSI) has been fluctuating around the 50 level, indicating a neutral stance in terms of momentum.
Momentum Analysis:
- Stochastic Oscillator: The Stochastic Oscillator has been fluctuating within the overbought and oversold levels, indicating potential reversal points.
- Williams %R: The Williams %R has been hovering around the oversold territory, suggesting a possible buying opportunity.
Volatility Analysis:
- Bollinger Bands: The Bollinger Bands have been narrowing, indicating decreasing volatility in the stock price.
- Volatility Indicators: The Bollinger Bands Percentage (BBP) has been decreasing, reflecting reduced price fluctuations.
Volume Analysis:
- On-Balance Volume (OBV): The OBV has shown a slight increase, indicating accumulation of the stock.
- Chaikin Money Flow (CMF): The CMF has been positive, suggesting buying pressure in the stock.
Key Observations and Opinions:
- Trend: The stock is currently in an upward trend based on the moving averages and MACD analysis.
- Momentum: The momentum indicators suggest a neutral to slightly bullish bias with potential reversal points indicated by the Stochastic Oscillator.
- Volatility: The decreasing volatility as indicated by the Bollinger Bands suggests a consolidation phase in the stock price.
- Volume: The volume indicators show positive accumulation and buying pressure in the stock.
Conclusion:
Based on the analysis of the technical indicators, the next few days for BLDG stock are likely to see a continuation of the upward trend with potential consolidation and minor pullbacks. Investors may consider buying on dips as the momentum remains positive, supported by increasing volume and accumulation. However, it is essential to monitor key support and resistance levels for potential trend reversals. Overall, the outlook for BLDG stock is bullish in the short term.